Pavel Ramanouski, Head of SAP BI and EPM practice at ACBaltica
Real-time reporting is a thing nowadays. It is a collective term for gathering, analyzing, and further presenting data as it becomes available, with as little delay as possible. By providing relevant and timely data to businesses, it allows them to address slow decision-making, identify inefficiencies, detect anomalies, and many more. Here is where SAP Analytics Cloud steps in — a contemporary, powerful tool enhanced with real-time reporting.
Questions to be answered in this article:
- What is SAP Analytics Cloud?
- How does SAP Analytics Cloud enable real-time reporting?
- How is real-time reporting useful?
What is SAP Analytics Cloud?
SAP Analytics Cloud, also known as SAC for short, is a solution with advanced analytics, planning, and reporting capabilities designed to increase business intelligence potential, turn data into valuable insights, and provide companies with the capability to make quicker, data-based decisions with a greater degree of confidence.
Essential real-time reporting capabilities in SAP Analytics Cloud
Let’s take a look at the real-time reporting features of SAC. This article will cover such tools as Financial Reporting, Data Analyzer, and Smart Features.
Financial Reporting
Financial reporting is about exactly what its name suggests — about providing you with accurate and timely financial data. It comes with three sections: overview, revenue analysis, and profit & loss.
Here is an example of such a report. It’s important to note that while it showcases capabilities of SAC’s Financial Reporting well, they are not limited to data presented here and can vary from report to report.
Overview
This section shows main financial metrics such as cost of goods sold, revenue, gross profit, and net profit. Data is presented in a visually appealing way so that you can easily understand all data points.
For example, it uses different colors to point out variances between the previous period (red for decrease and green for increase).
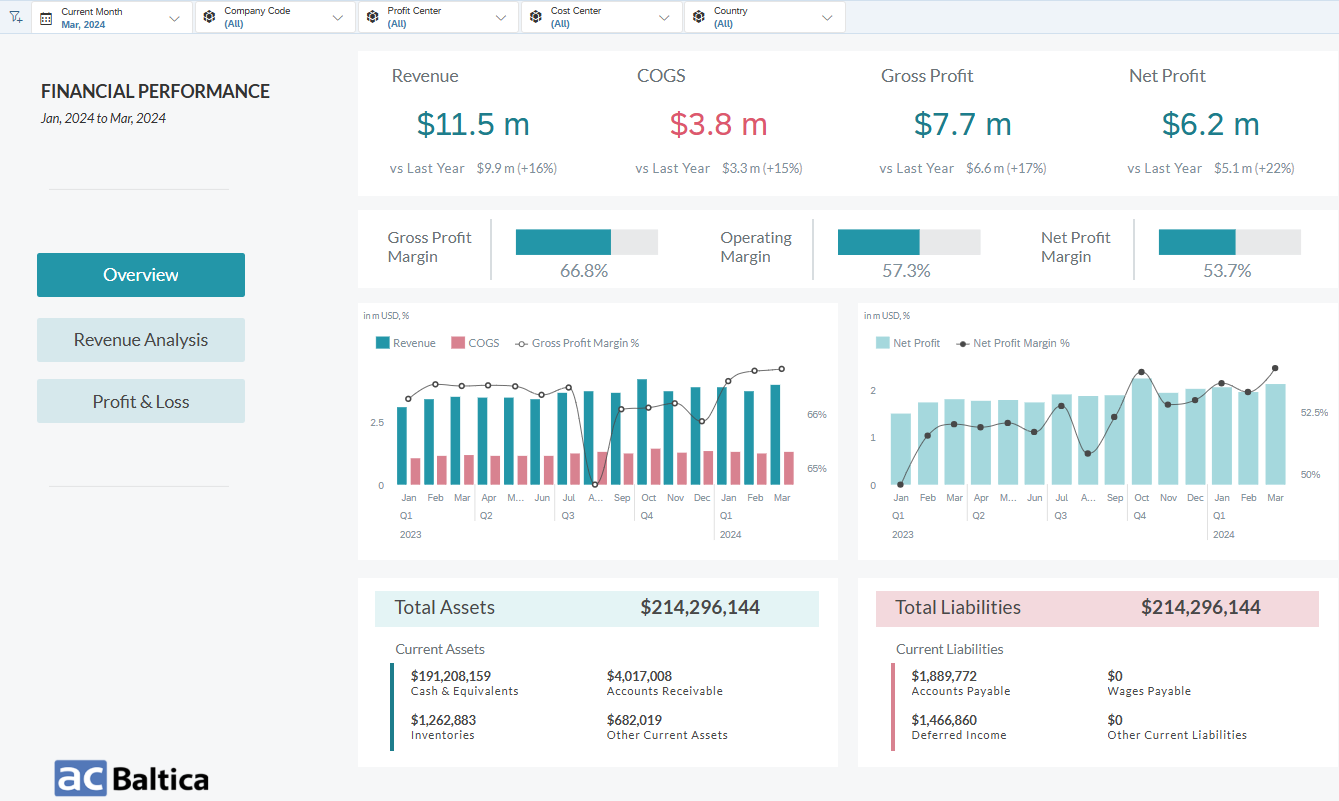
In addition to the indicators already mentioned, you can also keep track of operating margin, gross profit margin, and net profit margin. What’s more, here you can find eloquent graphs that allow you to check dynamics for different metrics. In addition, you get a balance sheet account overview with total assets and total liabilities.
All in all, the displayed data can be filtered by month, company codes, profit centers, cost centers, and countries. What’s more, you can also set up custom filters of your own.
Furthermore, you can easily interact with data: drill up or drill down, displaying data on the desired aggregation level. In a word, you can manage data in accordance with your task and goals.
Revenue analysis
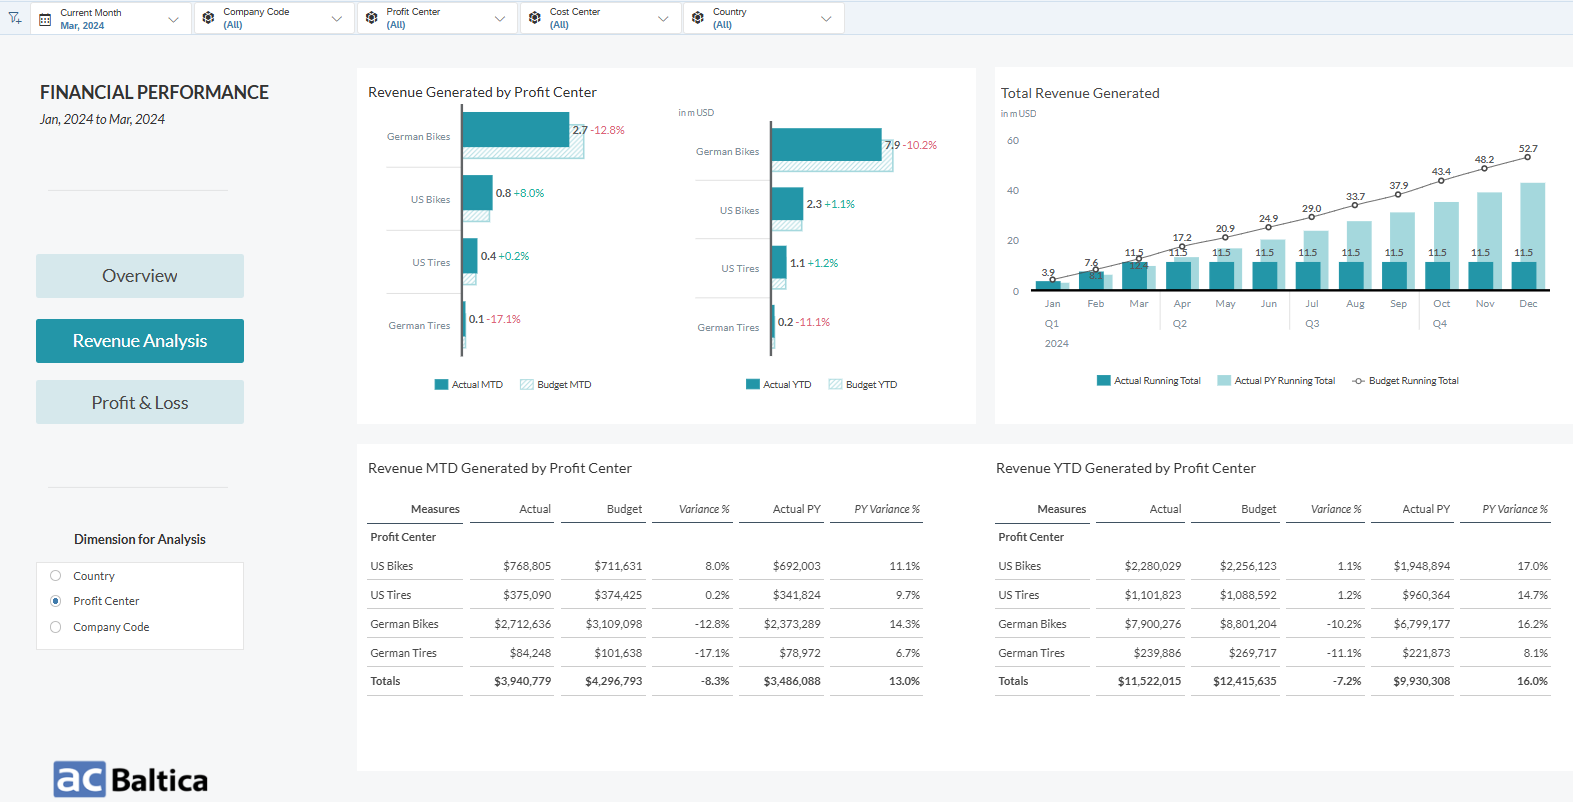
This section allows you to analyze the revenue growth based on the selected dimensions (country, profit center, and company code) so that you can identify high-performing and underperforming areas to optimize strategies accordingly.
Revenue can be compared month-to-date, year-to-date, actual versus budget, and actual versus previous year to allow you to quickly spot gaps, address underperformance, and reallocate resources. Thanks to this section, you can also understand seasonal revenue trends, recurring spikes and dips, and long-term growth and decline patterns.
To sum it up, it is not just about seeing numbers — it’s about understanding them in a way that drives strategic action.
Profit and loss
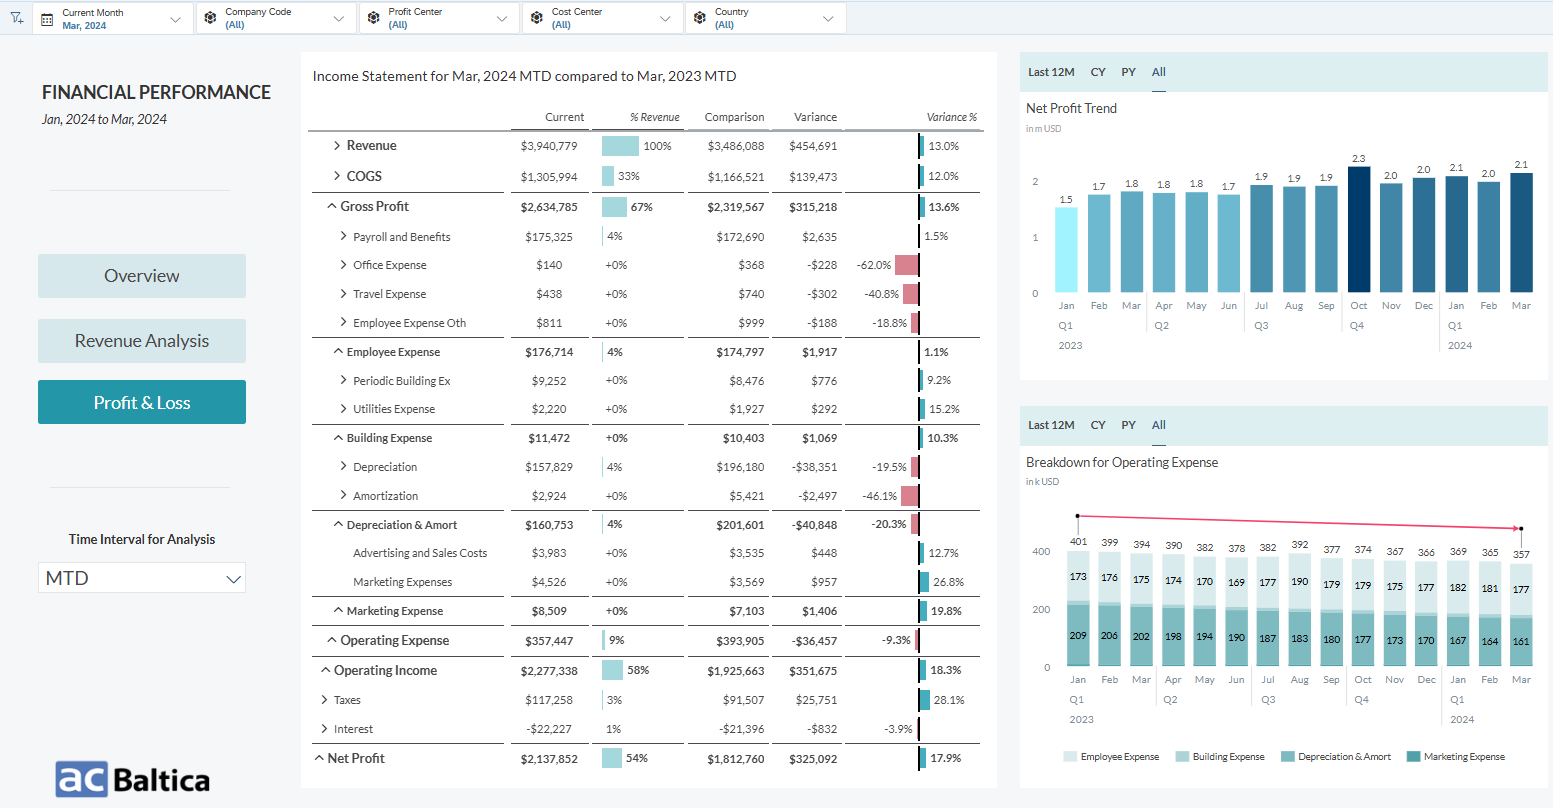
The profit & loss section provides a more detailed outlook on your company’s profit and loss statement. Using it, you can choose the specific time period you need for analysis. The report also features variances in both absolute and relative numbers.
This section is crucial for identifying operational efficiencies, uncovering cost-saving opportunities, and ensuring the business stays aligned with its strategic goals, among many others.
By the way, all the data we have just discussed can be exported in PDF to make sharing with other parties much easier.
Data Analyzer
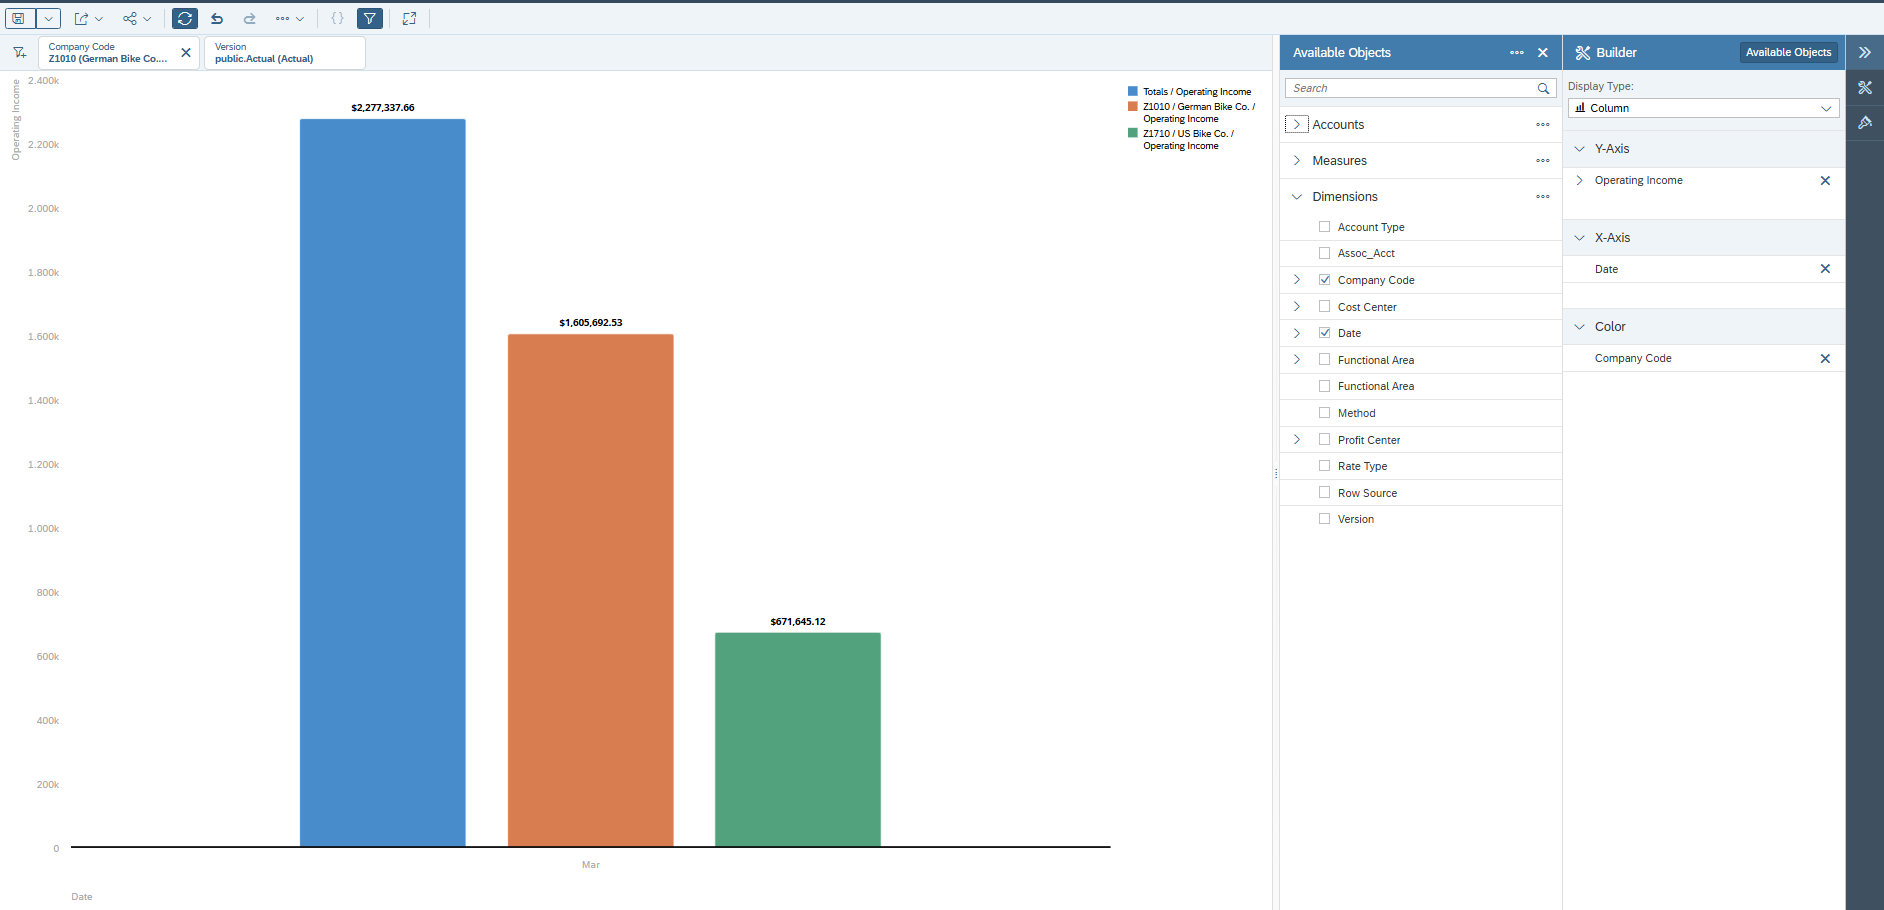
Now let’s turn to Data Analyzer, which is a powerful tool that offers an environment to dynamically explore data without any help from the IT department. You can launch this tool directly from the Financial Reporting and then access and analyze specific data you need. The main advantages of this tool are the possibility to view raw data in a clean table and use live data from SAP BW or HANA with no delay.
AI and predictive capabilities
Next come AI and predictive capabilities of SAC. These are tools that are based on machine learning and help users make more confident and wise decisions. They include Just Ask, Smart Predict, and Compass.
Just Ask

Just Ask is a natural language query interface that allows you to get the information you need from your data by simply asking questions in natural language. You get answers in different formats, including tables and charts. Among useful capabilities, I’d like to point out inference of similar words based on meaning as well as creating custom synonyms for master data and metadata.
Smart Predict
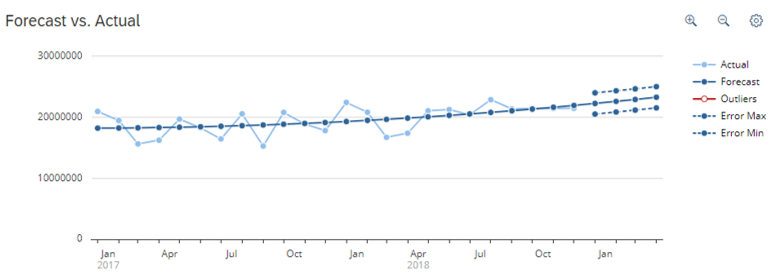
Smart Predict employs machine learning to predict events and trends in the future. It allows you to use predictive techniques of 3 types: classification, regression, and time series.
- Classification analysis helps you group new data into categories based on past examples.
- Regression analysis allows finding relationships between numbers.
- Time series forecast gives you the capability to look at your data over time to find trends and patterns.
Thanks to user-friendly design and no need for technical terminology and coding, this tool provides convenient access to the predictions you need. It can be utilized for various use cases, including revenue and cash flow forecasting, customer payment predictions, fraud detection, risk management, marketing campaign predictions, and determination of optimal inventory levels.
Compass
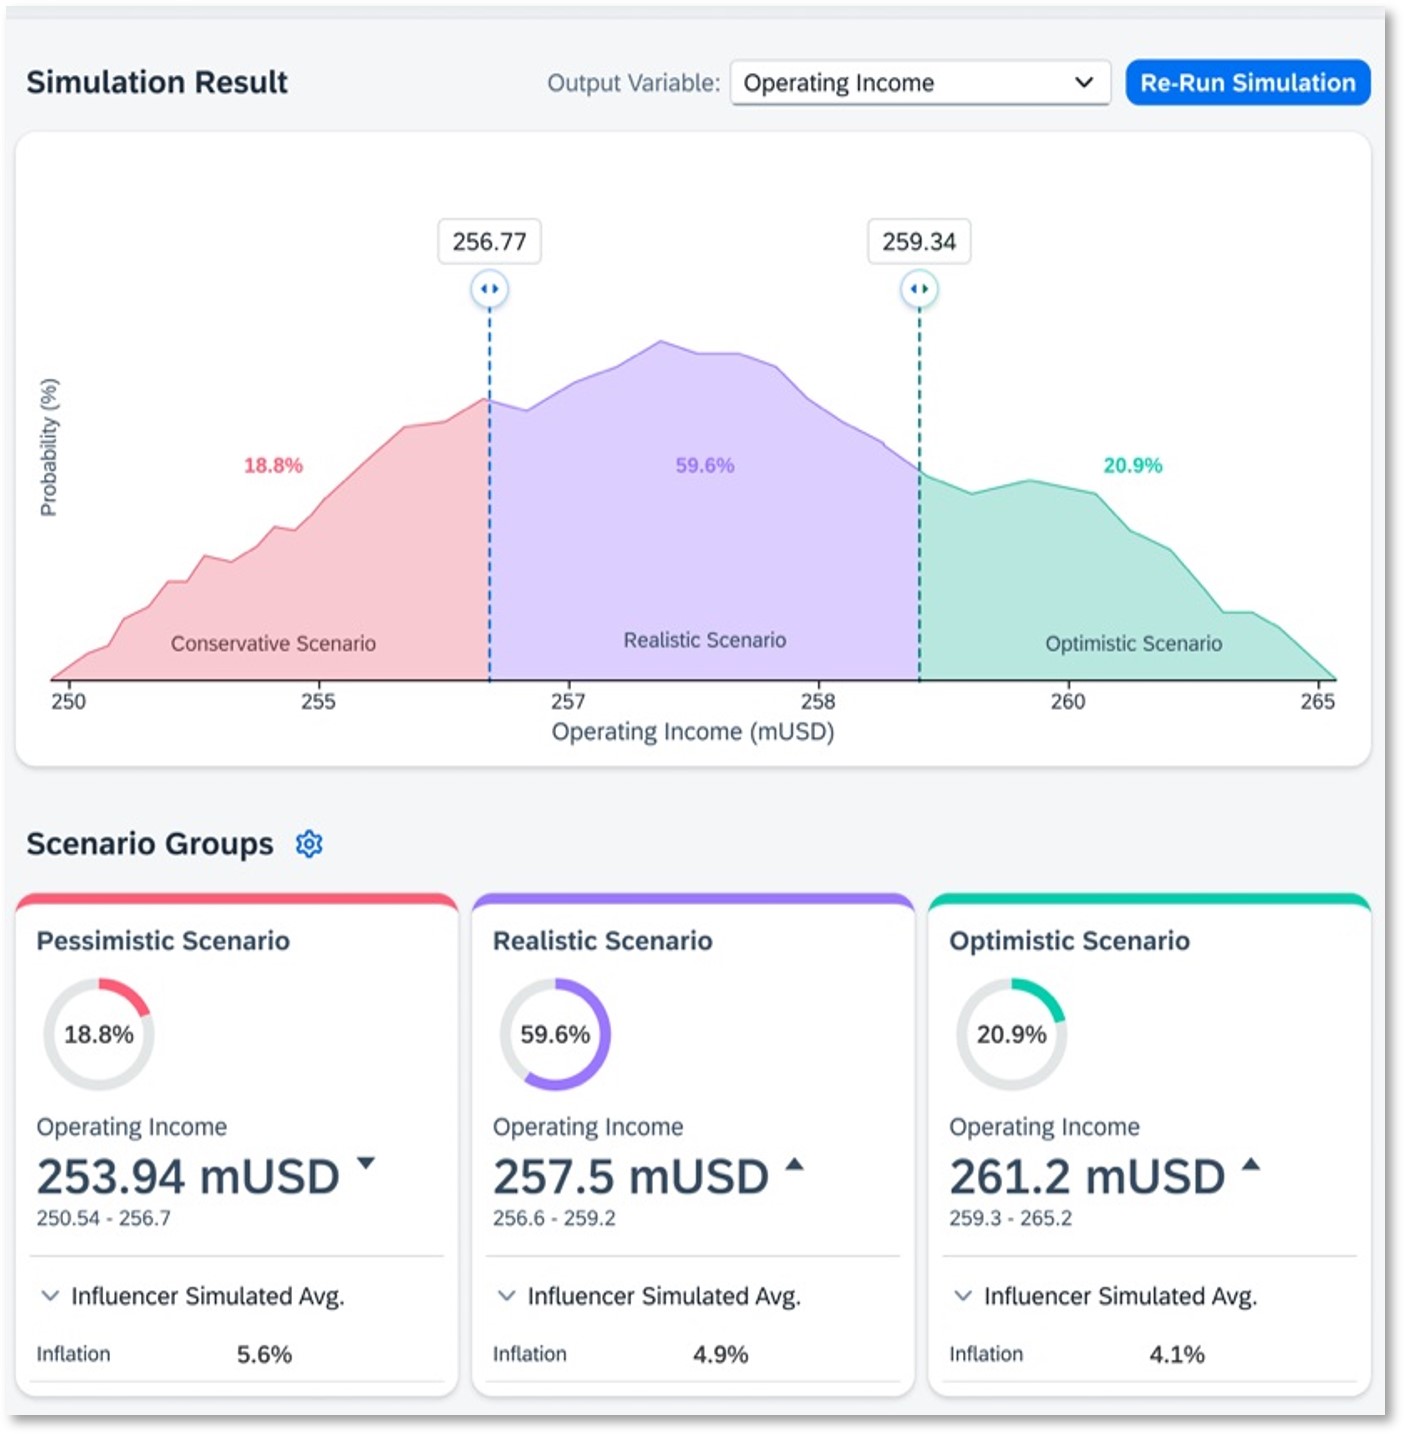
Compass is a feature used for smart simulations to analyze possible outcomes when you face uncertainties in performance drivers. It offers insights into possible pessimistic/realistic/optimistic cases. Using this tool, you can estimate future company earnings, how many employees might be needed, sales targets, expected revenue, ROI, and how long a project might take.
How SAC enables real-time reporting for strategic and operational decisions
It’s all possible thanks to live data connections and integration with the vast SAP ecosystem.
Live data connections
SAP Analytics Cloud quickly and easily sets up live data connections with cloud and non-cloud systems. The term “live”, in this case, means that when you open a report in SAC, even if this or that change is applied to the data in its place of origin, these changes will be displayed in the said report immediately, ensuring you are constantly updated.
Integration with SAP Ecosystem
As it’s usual for SAP solutions, SAC is an integral part of the SAP ecosystem, which consists of a wide range of interconnected applications that are at their best when they are together. Thanks to smooth and effortless connection to such apps as Datasphere, S/4HANA, SAP BW, and SAP HANA, among many others, you can retrieve for SAC any data you need. In addition, SAC can also integrate with 3rd-party systems to ensure access to as diverse data as possible.
Benefits of SAC real-time reporting capabilities for decision-making
When it comes to the positive effects SAC reporting has on decision-making, there's a lot to cover. The following are some of them.
Faster and more efficient reporting processes
Real-time reporting in SAC helps to eliminate troublesome delays that are pretty usual for manual data collection and report generation. Automated data integration and live data connections reduce the need for manual updates, allowing teams to focus more on analyzing trends rather than compiling spreadsheets.
Improved planning accuracy through live data
By using real-time data, SAC can enhance the reliability of your forecasts and planning activities. Planners can create scenarios based on current performance metrics and not on outdated figures, which leads to the reduced risk of inaccuracies.
Empowered decision making with smart features
SAC’s Smart Features offer AI-driven recommendations and automated insights that support informed decision-making. These tools help users understand data patterns, anomalies, and key influencers without requiring advanced data science knowledge.
Conclusion
In today’s data-driven world, data is a valuable asset that should be used mindfully and expeditiously. And you can do it with SAP Analytics Cloud real-time reporting. Thanks to the vast number of data points, it offers and the possibility of their flexible display in Financial Reporting, the impressive analytical capability of Data Analyzer, and the convenience that Smart Features bring to the table, SAC empowers you to make important decisions based on accurate and relevant data.


