

Pavel Ramanouski, Head of SAP BI and EPM practice at ACBaltica

Let's start from the strategic workforce planning cockpit. We can open the first story.


In this section, planners can adjust workforce parameters and test different strategies.


SAP Analytics Cloud (SAC) is a modern analytics and planning platform that consolidates data from human resources (HR), finance, and operational systems. It helps companies forecast, model scenarios, and make strategic decisions based on data.
Our article will guide you through strategic and operational workforce planning in SAC. You will learn how to analyse your current employee structure, identify key factors and turnover forecasts, create a baseline planned population, forecast headcount, compare projected supply with business demand, pinpoint gaps, and devise strategies to address them. You will also learn how to evaluate the financial implications of your chosen strategy in SAC.
This SAP Analytics Cloud workforce planning guide should help you understand where your company is now and develop a plan to manage your workforce. It will help you make better decisions in HR and finance.
Strategic workforce planning process in SAC
Here is what the SAC homepage looks like. From here, users can access their favourite Stories, which serve as reports or planning tools in SAP Analytics Cloud.
Let's start from the strategic workforce planning cockpit. We can open the first story.
The standard process in SAC workforce planning guides planners through several stages:
-
Analyse the current workforce;
-
Identify workforce influencers;
-
Prepare the planning population;
-
Forecast workforce supply;
-
Plan retirements;
-
Define demand drivers;
-
Calculate workforce demand;
-
Identify workforce gaps;
-
Define a response strategy.
So, it’s not zero-based budgeting or forecasting; all results are data-based.
Analyse the current workforce
SAC Workforce planning always starts with understanding the current workforce structure.
To begin the analysis, click “Know Your Workforce”:

The system displays workforce statistics based on data from the HCM system. You can analyse employees by multiple dimensions, including Age, Ethnic Background, Gender, Job Family, Location, Managerial Employee, Operational Unit, Performance Rating, Succession Readiness, and Tenure. When you switch the comparison criteria, the diagram in SAC updates immediately and shows how the workforce distribution changes:
Retirement and termination trends
Scrolling down, you will see the Retirement and Terminations section. Here you can analyse trends by different criteria such as Location, Gender, Age, etc.

Hiring statistics
The next section shows historical hiring trends:
This part helps review and understand how the workforce has grown over time and how hiring patterns have changed.
Together, these views provide a clear picture of the current workforce baseline, which is essential before starting any forecasting.
Understand workforce influencers
Once you understand the current workforce structure, the next step is to identify what drives workforce changes.
Navigate to “Understand Influencers” in SAC.
SAP Analytics Cloud provides built-in predictive and AI capabilities that help identify factors influencing workforce behaviour.
Now you can analyse the retirement factors:
SAC has different predictions and AI functionality. To use it to understand the retirement factors, click “View Classification Prediction” in the upper right corner to open the classification prediction model.
The model analyzes historical HR data and predicts which factors most strongly influence retirement:

The system displays the model’s predictive power. In this example, the model achieves 93.9% accuracy, indicating strong predictive capability.
On the right side, you can define what you want to predict and which factors should be evaluated as influencers:
After that, the system will give you the statistics on Influencer Contributions:


And also, below you will see the Detected Target section:
Based on that, you can analyse results in a graphical view.
If you want, you can go even further and analyse data by Job Family and Age:
For instance, the analysis might reveal that administrative support employees with long tenures are more likely to retire soon. Additionally, sales account managers aged 60 or older are more likely to retire.
These insights help identify vulnerable areas in the workforce structure, allowing planners to prepare early.
Prepare the planning population
After analyzing workforce trends, the next step is to define the planning population.
This step organizes SAC workforce data into a structure suitable for planning.
It includes information such as the current workforce, planned workforce increases, projected retirements, and planned workforce reductions. The data covers several planning years.

SAC workforce planning allows you to simulate different Strategic Workforce Planning scenarios, such as High Growth or Low Growth.
When you select a scenario, the diagram immediately updates and shows the potential workforce impact.
This allows planners to quickly understand how business growth scenarios affect workforce needs.

Forecast supply
The next step of SAP Analytics Cloud workforce planning focuses on forecasting workforce supply.

In this section, users can create forecasts for current workforce, workforce increases, and workforce reductions.

Below the forecast visualization, planners can manually adjust workforce numbers.

When adjustments are made, the system automatically recalculates the forecast.
Once the forecast is finalized, you can publish the data so it becomes available for planners across the organization.

Plan retirements
In SAC, you can plan retirements. For this, you need to go to the following section:

Here you can analyze retirement trends using visual dashboards.


Adjust retirement probability
Planners can adjust the retirement probability:
-
at the company level;
-
for specific organizational units;
-
for specific job families.
The system then calculates the expected number of retirements based on the number of employees currently eligible for retirement.
After adjusting the assumptions, click “Calculate Future Retirements” in the upper right corner:

The system recalculates projected retirements and updates the workforce supply forecast.
Define demand drivers

The first column is for driver values, and the second is for driver weight. The system calculates the year-over-year value in the third column. On the screen, you see driver one (marked) and driver two (on the right). Using the combined year-over-year driving data, you can calculate demand based on your current headcount.
Demand Headcount
Now, let’s navigate to the Demand Headcount:
Here, you will see the calculated workforce demand for each organizational unit and job family for each planning year.
This calculation uses your current headcount and the growth of demand drivers.
You can view the results in either a table or a visual format:

If you're interested in specific organizational units, click “Organization Unit” and choose the one that best meets your needs. For example, “Operations”.

And clicking on it, the system gives you the following table with the information on headcount demand, job family in operations organizational unit:

This way, you forecast workforce supply, adjust it based on influencers, apply predictive models, and make manual adjustments, including planned retirements with defined probabilities and eligibility dates. At the same time, workforce demand is calculated based on demand drivers and the current headcount.
Perform gap analysis
Now that both supply and demand are calculated, SAC can identify workforce gaps.

For example, the analysis may show a workforce gap of 6,000 employees in 2026 and an even larger gap in 2027:
You can drill down into the results. For example, you can filter by Corporate → Financial Control to analyse workforce gaps for a specific function:

You can also review the gap for each job family:

This analysis highlights where the organization may face future talent shortages or surpluses.
Define a workforce response strategy
Once workforce gaps are identified, the next step is to define how to close them.
Possible actions include:
-
hiring new employees;
-
using contractors;
-
internal workforce movements;
-
reducing attrition;
-
restructuring teams.
For this, you go to the Response Strategy window:
In this section, planners can adjust workforce parameters and test different strategies.
Here, you can explore the calculated average training and recruiting costs aggregated at the top level of organizational units. You can also navigate to full-screen mode for a more detailed analysis:
You can adjust any number in this table, and the other parameters will be recalculated automatically. For example, if you decrease Customer Relations to 800 and increase the Average Recruiting Cost for Corporate Strategy to 2,500, the system will respond in the same table:
You can always see your average drivers in your accounting system. Here's our base assumption:
As you can see in our example, the system shows the adjusted gap for organizational units. Overall, it balances correctly (see the last column). However, there are some inconsistencies that need to be addressed: too many employees in Energy and Utilities and not enough in Corporate.
By transferring employees internally, you can close the gap without external hiring. This helps optimize workforce distribution across the organization.
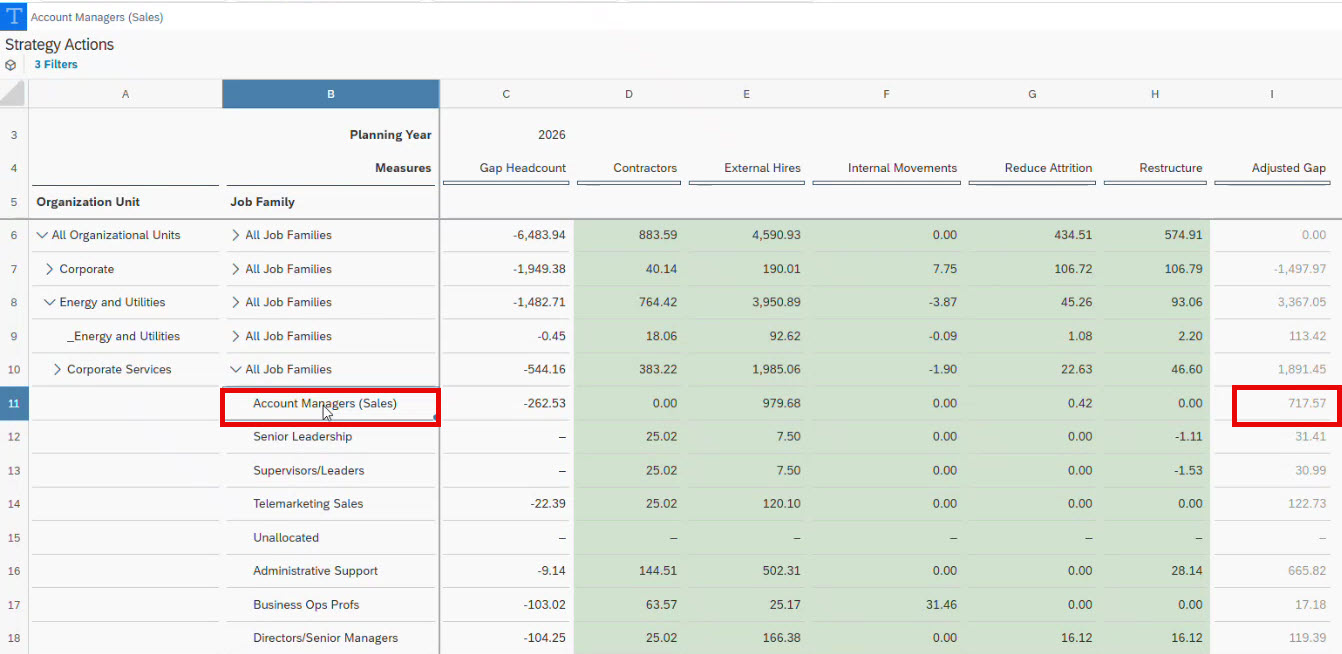
For example, you can take Corporate services. You see that there are more account managers than required based on the calculated demand:
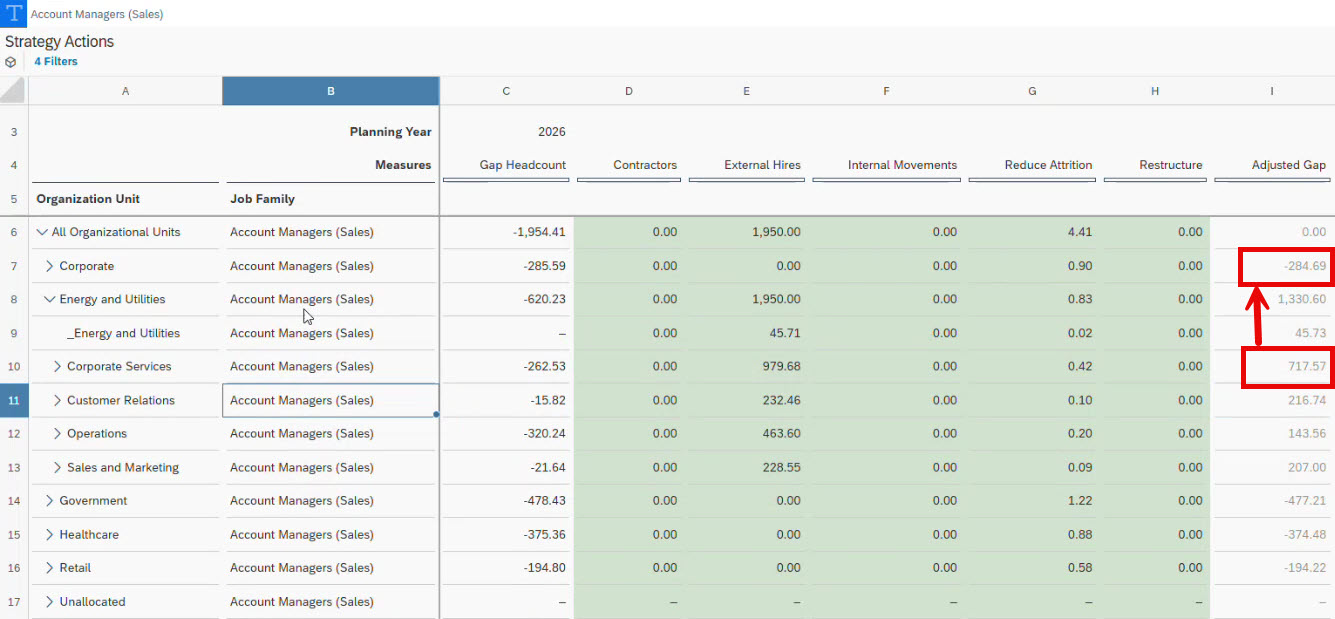
Therefore, you can move some workforce to Corporate:
This way, you close the gap:
Estimate strategy cost
SAC also allows you to calculate the cost of each workforce strategy:
The system considers average training and recruiting costs:
This allows planners to compare strategies not only by workforce impact, but also by financial efficiency.
Compare workforce strategies
To evaluate the final strategy, open the Response Dashboard:

Here you can visualise the comparison of the Do Nothing Scenario and the Selected Response Strategy.
The dashboard also shows:
- Your strategy action plan:


- Total strategy costs:


SAP Analytics Cloud workforce planning helps decision-makers select the most effective workforce strategy for their business needs.
Business value of SAC strategic workforce planning
SAP Analytics Cloud's strategic workforce planning feature enables companies to transition to a thoughtful, data-driven HR strategy.
The platform combines current headcount and employee skill data, business metrics, forecasts, and financial models. This helps companies:
-
Identify staffing shortages early, during the planning stages: You can see where shortages may occur in advance and plan accordingly, whether that means hiring, restructuring, or training.
-
Align workforce planning with business growth: The number and composition of the workforce adjust to the company's actual goals and plans.
-
Reduce hiring risks: The system provides forecasts and scenarios to help you make data-driven decisions, reducing the likelihood of recruitment mistakes.
-
Distribute employees optimally across departments: The platform shows where there is an excess or shortage of staff, enabling reallocation without unnecessary costs.
-
Immediately reflect the financial implications of HR decisions, including hiring, training, and interdepartmental transfers.
As a result, you will have an HR management action plan that considers real data and business goals, helps you save resources, and establishes a long-term HR strategy.
Also read: ACBaltica article "How SAP Analytics Cloud adapts to different SAP landscapes"
FAQ
How is workforce demand calculated in SAP Analytics Cloud?
In SAP Analytics Cloud, workforce demand is calculated based on the current headcount across job families and organizational units, combined with business demand drivers. These drivers represent factors that influence workforce needs, such as revenue growth, production volume, or business expansion.
Organizations can adjust these drivers during implementation to reflect their business model. For example, instead of using two standard drivers, companies may define several drivers that better represent how workforce demand grows with business activity.
Can demand drivers be customized for different industries?
Yes. Demand drivers are flexible and can be adapted to the specific industry and business model.
For example, in the retail workforce, demand may depend on store count or sales volume, while in manufacturing, it may be linked to production capacity. In professional services, demand is often connected to revenue or billable hours.
During implementation, planners define the drivers that best explain how business growth affects workforce demand.
How many demand drivers should be used in SAC workforce planning?
There is no fixed number of demand drivers. The right number depends on the organization’s business model complexity.
Many companies start with two or three key drivers. More complex organizations may use four or five drivers to capture different aspects of business growth. The goal is to identify the main factors that influence your specific workforce demand rather than create unnecessary complexity.
Can planners adjust workforce demand forecasting in SAP Analytics Cloud manually?
Yes. While demand is initially calculated using demand drivers and current headcount, planners can manually adjust forecasts.
This allows organizations to integrate additional business insights, such as upcoming projects, restructuring plans, or market changes that are not yet reflected in the data.
How accurate are workforce forecasts in SAP Analytics Cloud?
Forecast accuracy depends on the quality of historical workforce data and the planning assumptions used.
SAP Analytics Cloud uses forecasting models to identify workforce trends such as attrition patterns or retirement probabilities. This data helps organizations estimate future workforce availability, but the goal is not to predict exact numbers. Instead, workforce forecasting helps organizations discover potential workforce gaps early and plan accordingly.
How does workforce planning connect to financial planning?
Workforce planning is closely linked to financial planning because workforce costs are often one of the largest expenses in an organization.
In SAP Analytics Cloud, workforce plans can be integrated with financial planning models. This allows organizations to estimate the financial impact of workforce decisions, including hiring costs, salary budgets, training investments, and restructuring expenses.
Subscribe