Thanks to SAP software bank improved sales, marketing and contact center efficiency by 3-4 times.
The ability to analyze and visualize data effectively is essential for modern enterprises. However, working with enterprise-level data requires strong data analysis skills, making it complicated for business users to create custom reports and seek insights without help from data analysts.
SAP Business Objects is a game-changer for companies facing the challenge of complex data analysis. It is a set of business intelligence (BI) tools that significantly simplify reporting and analysis for business users, empowering them to build reports or perform predictive analysis without the constant involvement of data analysts.
SAP Business Objects is not just a standalone tool but a versatile platform that seamlessly integrates with various SAP and non-SAP applications. This integration serves as a central hub, ensuring data consistency and quality while enabling comprehensive data analysis and reporting. It ensures that data from different sources is accurately collected, processed, and presented in an easily understandable format. Business users can then search and analyze that data using only drug-n-drop features. This approach ultimately helps ensure a unified view of business operations, enhancing performance monitoring and strategic planning.
Furthermore, integrating SAP Business Objects with the SAP Business Technology Platform (SAP BTP) enhances data processing capabilities, ensuring high performance and scalability.
Benefits of SAP Business Objects
-
Enhanced data visualization
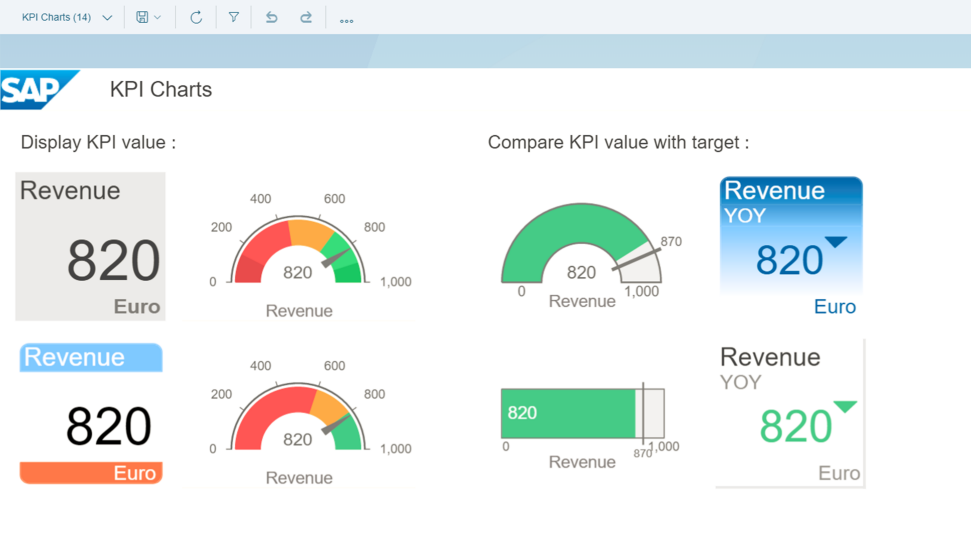
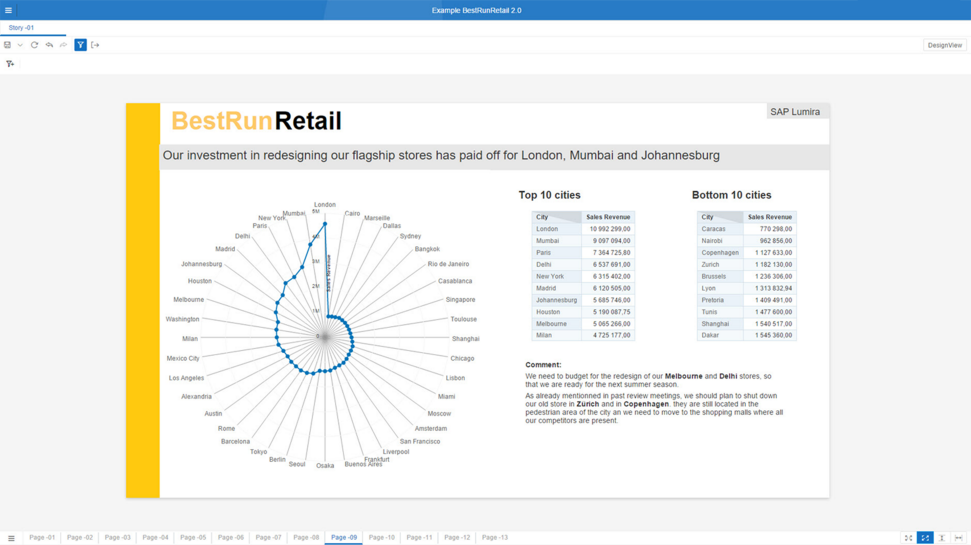
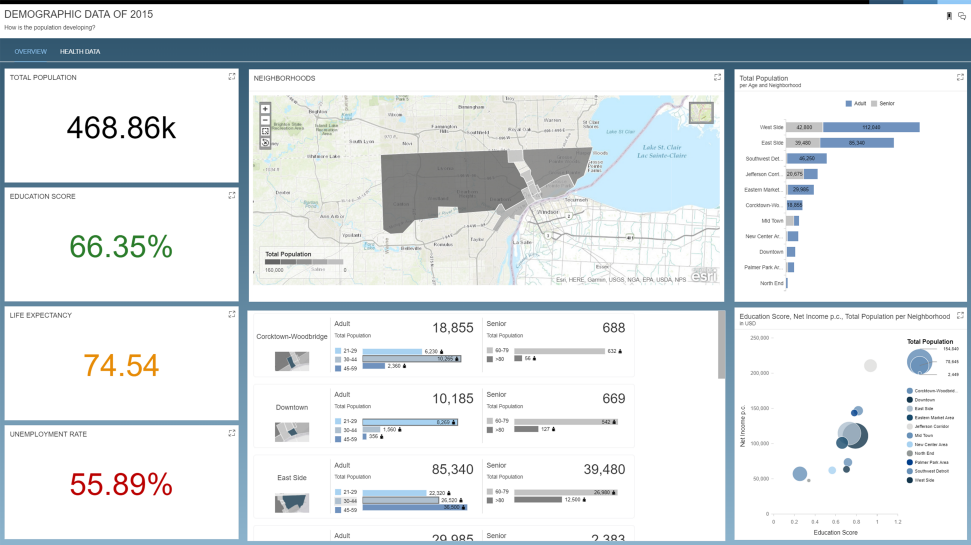
Easily create impactful visualizations, dashboards, and applications – without engaging data analysts.
-
Efficient reporting and analysis
Empower business users with ad hoc queries and BI reporting to understand trends and root causes.
-
Omnichannel data analysis capabilities
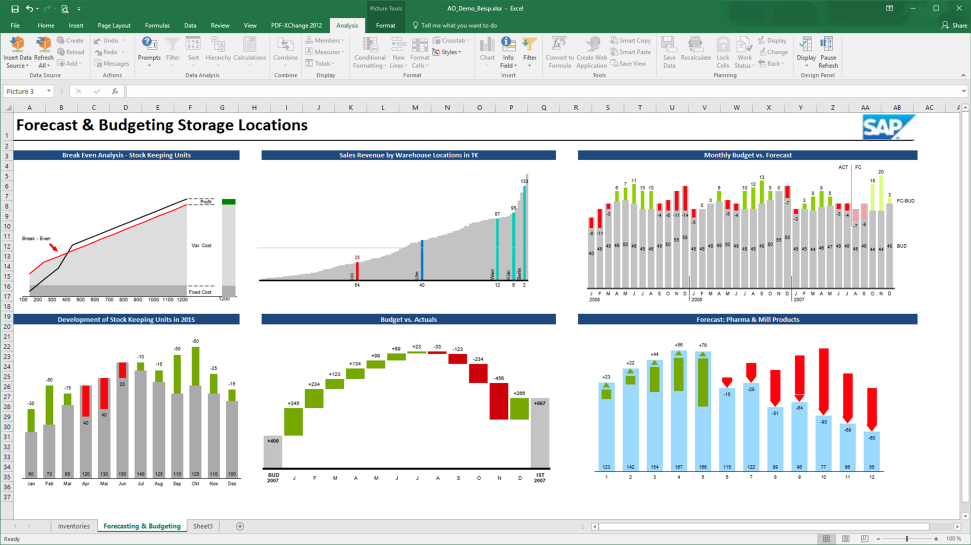
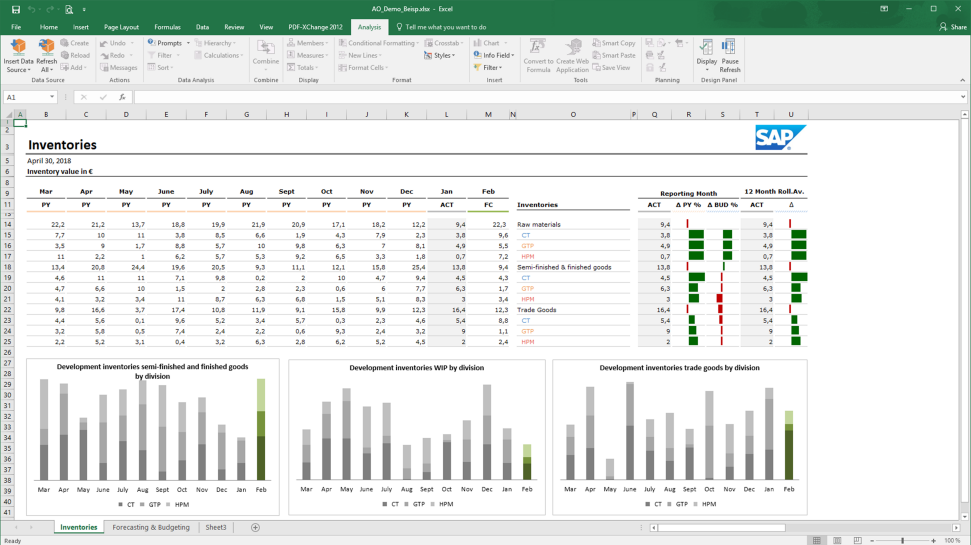
Integrate with SAP Business Objects with Office applications to utilize multidimensional data analysis, enabling users to filter and manipulate data directly in familiar environments, identifying trends and outliers.
-
Comprehensive analytics applications
Build and deploy analytics applications tailored to specific business needs and with specific role-based access levels.
SAP Business Objects Suite
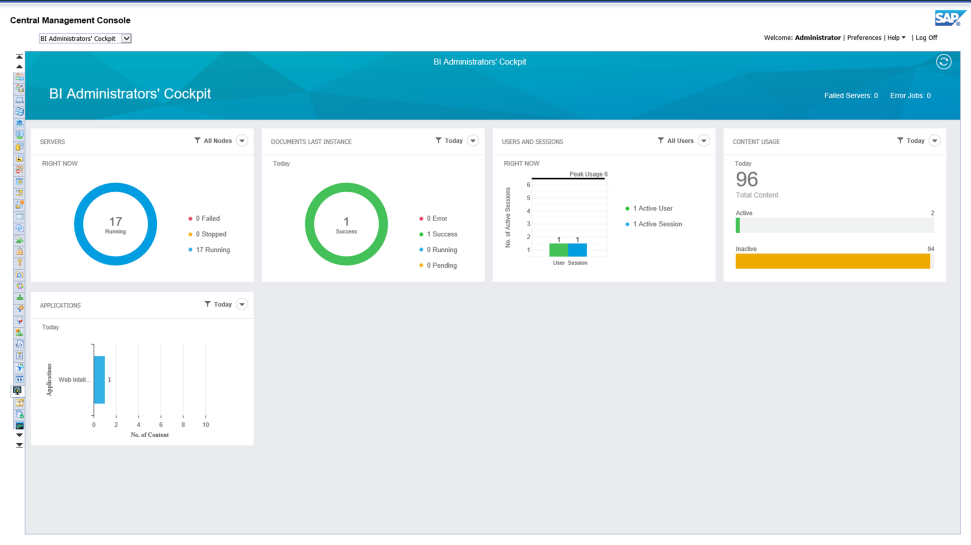
SAP Business Objects is a suite of tools and applications designed to make working with data easier and more convenient for business users. Each application has a specific functionality. Here’s a description of the main blocks:
Key Capabilities of SAP Business Objects
- Ad-hoc Reporting. Empower users to create and modify reports on the fly. Users can access various data sources, customize queries, and design reports that meet their needs.
- Advanced Analytics. Perform complex analyses with advanced functions such as predictive analytics, what-if scenarios, and trend analysis.
- Interactive Analysis. Utilize powerful tools for interactive data exploration, allowing users to drill down into details, filter data dynamically, and identify patterns and anomalies in real time.
- Scheduled Reporting. Automate the distribution of reports by scheduling them to run at specific times. Reports can be delivered via email or saved to shared locations, ensuring timely access to critical information.
- Comprehensive Data Access Connect to various data sources, both SAP and non-SAP, ensuring comprehensive access to all relevant data for reporting and analysis.
- Self-service capabilities. Intuitive, self-service visualization tools for an easy understanding of data combined from several sources, trend analysis, and more.
- Role-based dashboards. Interactive, role-based dashboards for easy information delivery to decision makers – anytime, anywhere, on any device.
- Cross-enterprise sharing. A robust sharing functionality to communicate business insights with colleagues and support decision-making across the company.
- Real-time analytics. IIntegrations with SAP Business Warehouse and SAP HANA to power real-time analytics.
- Large-scale data analysis. Ability to analyze large data sets to discover in-depth business insights and forecast business drivers using Microsoft Excel.
- Integration with the Microsoft Office package. Easy embedding of data analytics information into Microsoft PowerPoint presentations, Excel files, or Word to enable users to create dynamic and data-driven presentations, documents, and reports for stakeholders.


