Pavel Ramanouski, Head of SAP BI and EPM practice at ACBaltica
If you’ve worked in business planning, you know how it is: spreadsheets everywhere, manual adjustments, data living in silos, and way too many “final_final_v3.xlsx” files around. It’s a process that often feels more like an administrative one than one of strategy.
SAP Analytics Cloud changes that.
Planning in SAC isn’t about simply putting numbers into boxes. It’s about connecting real data to real decisions — collaboratively, in real time, and with fewer headaches. From financial planning to cost allocation, from revenue projections to workforce plans, SAC offers tools to manage the full planning cycle in one place.
This article breaks down what that looks like, what features you get, and why it matters. Let’s go step by step.
Why planning needs to be different now?
Markets change fast. Planning cycles, budgets, and forecasts — they can’t take months anymore. Businesses need tools that let them react and adjust in the moment. Not once a year. Not even once a quarter.
That’s why planning needs to change. It has to be quicker, more flexible, and ready to adjust when things don’t go as expected (which is most of the time). You need a setup where planning isn’t something you do once a year and then hope for the best. It has to happen alongside everything else — right in the middle of your daily work.
That’s the problem SAC planning is designed to solve. It gives you a space where analysis, planning, forecasting, and reporting happen together — not in separate apps or files. The result? Faster decisions, cleaner collaboration, and more strategic control over your numbers.
Rapid Financial Planning and Analysis Suite: ready to use from day one

SAC for planning offers standard functionality available out-of-the-box, which is a huge win for companies that want quick wins without long implementation cycles.
One of the most popular prebuilt packages is the Rapid Financial Planning and Analysis Suite for S/4HANA. You can think of it as a set of planning accelerators. It’s already structured, tested, and built with best practices in mind. So instead of setting up templates or defining models for months, you get to start right away with something that’s flexible enough to adjust but solid enough to run as it is.
The Rapid Planning Suite is split into four main blocks:
-
Rapid Finance
-
Rapid Sales
-
Rapid Workforce
-
Rapid Capital
Each of these covers a core part of company planning. But for now, let’s focus on finance because that’s where most companies feel the pain first.
Rapid Finance
It is safe to say that financial planning touches everything. It’s not just about budgets or cost centers — it’s about keeping your whole business on track. When finance planning works, operations follow. When it doesn’t, you get chaos.
Rapid Finance gives you a structure to avoid that chaos. It’s built to cover the key financial processes most companies need — without reinventing the wheel for every project.
It includes:
- Dashboards to get an instant read on the numbers.
- Reports that go beyond basic views and let you compare versions, track actuals vs. plans, and monitor KPIs.
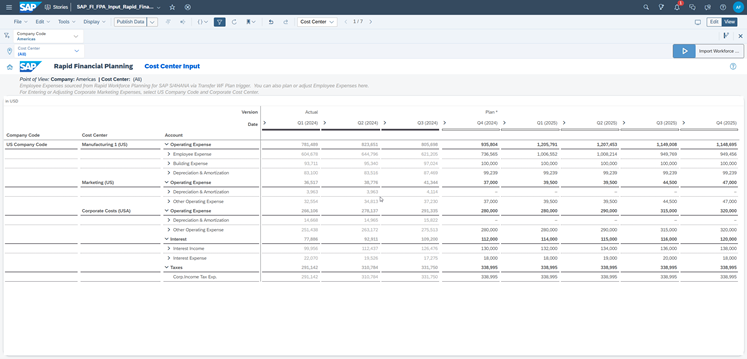
- Planning-enabled templates for cost centers, profit centers, allocations, and balance sheet projections.
- Admin tools to control versions, user roles, tasks, and workflows.
The idea is simple: you don’t waste months building planning mechanics — you start using them and then adapt as needed.
Planning-enabled templates
These templates are here so you don’t have to start from scratch. You get straight into planning, with the basics already set up.
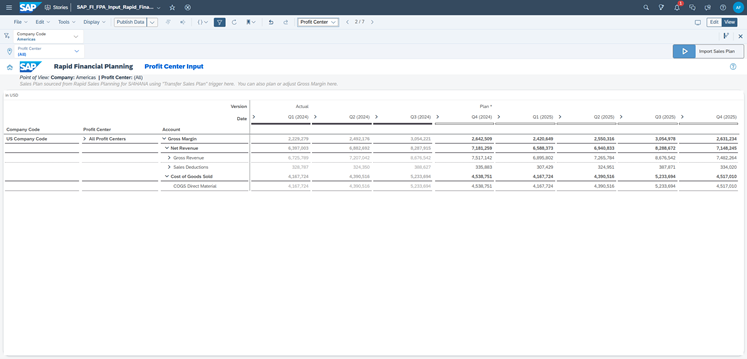
Profit center planning is about gross revenue, sales deductions, and COGS. It lets you break profitability down by product line, region, business unit, and so on. You can tweak pricing strategies or adjust COGS assumptions and immediately see what happens to your margins.
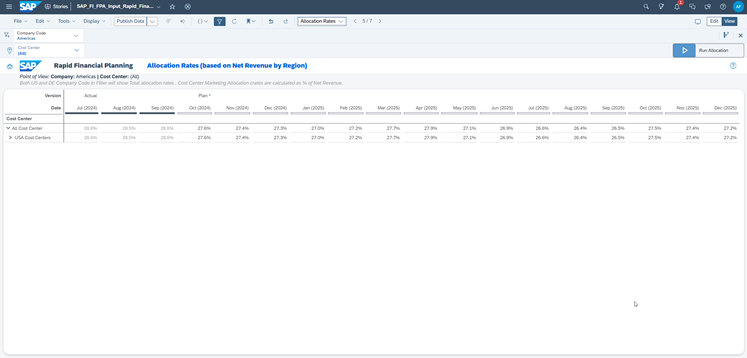
Allocation rates help you spread shared costs — like HR, IT, or office overhead — across the departments or products that actually use them. It’s about fairness. No more hiding costs in one corner of the business while another gets a free pass.
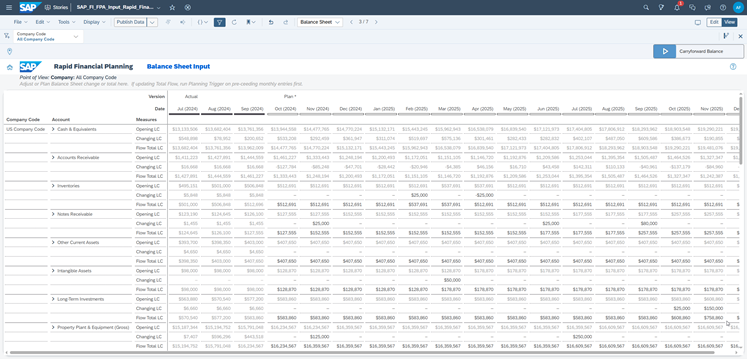
Balance sheet planning handles working capital, debt projections, and liquidity. It’s not just an isolated forecast — it’s about making sure your P&L, cash flow, and balance sheet stay aligned. That way, you’re not planning for profits while forgetting about cash.
Reporting: Because Planning Is Only Half the Job
Planning is never the whole story. You can build the smartest plan in the world, but if you’re not monitoring what’s actually happening, the whole thing falls apart.
That’s why reporting is such a critical part of SAP Analytics Cloud. It’s not just about making decisions before the year starts — it’s about watching how those decisions play out, month after month, with real data coming in.
Financial Statements & KPIs
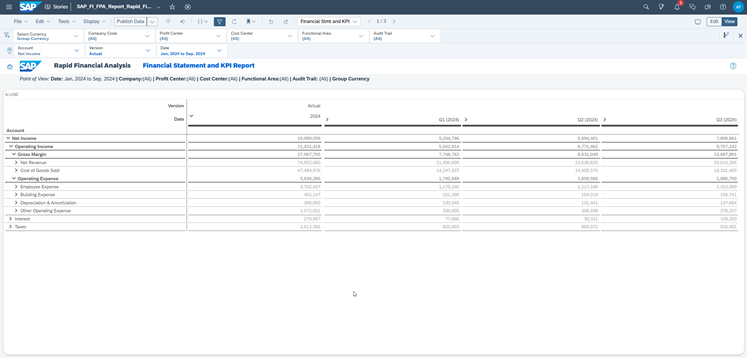
This is where you keep an eye on the big picture. You can pull up your P&L, balance sheet, and cash flow reports — fully connected to your planning data and always current. It is important to note that the data comes in the way you need it. Local currency, group currency, or any custom conversion — it’s all supported.
Filters make life easier too. You can break things down by profit center, cost center, functional area, or even audit trail. So, whether you’re tracking overall profitability or drilling into specific departments, you have full control.
Trend Reports
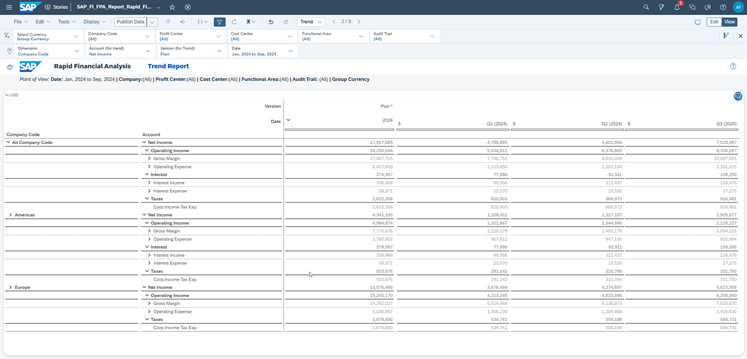
With trend reporting, you can compare how different company codes are performing over time. Maybe you want to look at this year vs. last year. Maybe you need to compare different legal entities or product lines. You pick the periods, the account groups, or the organizational units — and the system handles the rest. This makes it easier to track key drivers of operating expenses and net income. You don’t just see the numbers — you see the movement, the patterns, and the why.
Variance Analysis
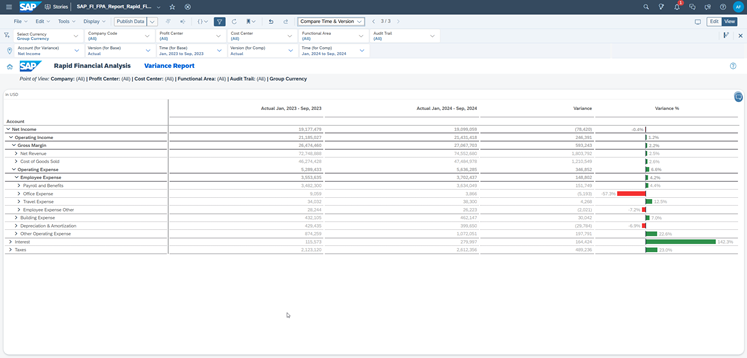
Plans are great, but reality rarely matches them perfectly. That’s where variance analysis comes in.
SAC lets you compare your planned figures with actuals — not just at year-end, but continuously, across different periods or different versions of your plan. You can break down the variances by KPI or cost element, which means you don’t just see that something changed — you understand what changed and why. The goal isn’t just to highlight gaps — it’s to catch them early enough to adjust course, before those gaps become real problems.
Dashboards: See the Big Picture Before You Zoom In
Planning isn’t just about building numbers — it’s about knowing where you are right now. Dashboards give you that view. Not a wall of data, but a quick read on what’s happening across the business. You get the key numbers first, then decide where you want to drill down.
Dashboards in SAC aren’t window dressing — they’re working tools. They connect directly to live data, so what you see is always current.
Overview Dashboard
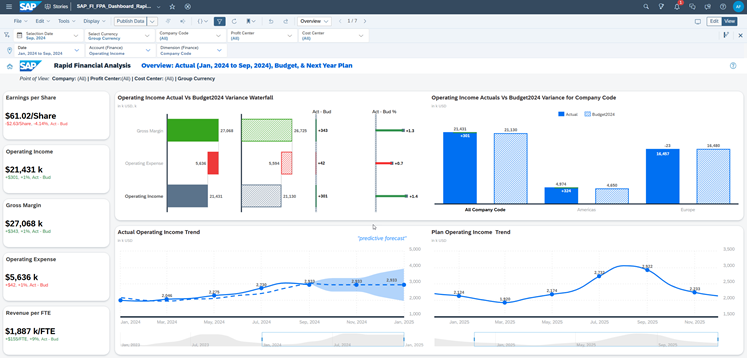
The Overview Dashboard shows you the core financials: earnings per share, operating income, gross margin, and operating expenses. These are the numbers that tell you, in plain terms, how the business is doing.
There’s also a waterfall chart that breaks down the shifts in income. You can see what’s pushing things up — and what’s pulling things down.
Actual vs. YoY Variances
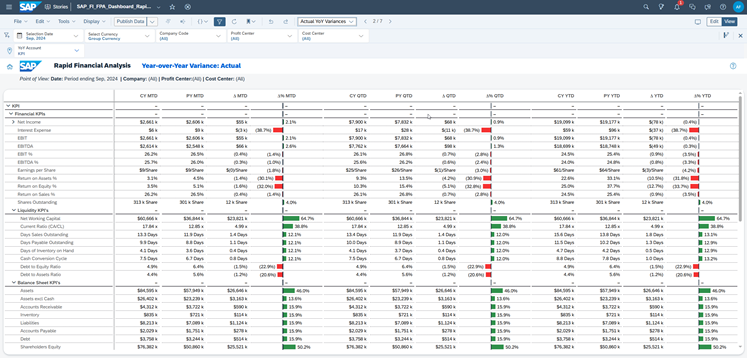
This dashboard answers the simple but critical question: How did this year compare to last? You can see exactly where the numbers changed — by region, by product, by channel. Not just the totals, but the movement behind them. It gives you a clean look at what shifted, so you can decide what needs attention next.
The Planning Cycle in SAC: How It Actually Works
Planning isn’t a one-off task. It’s a loop. Assumptions change, markets shift, and costs move. Planning in SAC is built for that — not just for drafting, but for adjusting.
Here’s how it works:
- Input and model setup
Start by setting the structure: KPIs, dimensions, drivers, and versions. You build this once and refine it as things evolve. - Data collection
Pull in actuals from S/4HANA, BW, Datasphere, or other systems. Past plans come in too — so you can compare, not guess. - Simulate and adjust
Run what-if scenarios without breaking the base plan. Build rolling forecasts, test best and worst cases, and use predictive tools. Check the impact before you commit. - Collaboration and review
Everyone gets involved — sales, finance, and operations. SAC makes it smoother: private versions for testing, comments directly in the system, and reviews done live. - Publish and monitor
Push the plan live — but stay flexible. Track actuals vs. plan, catch variances early, and adjust forecasts as you need.
The benefits: Why SAC planning?
Let’s summarize what SAC planning actually gives you:
- Faster deployment with ready-to-use templates and models.
- More confident decisions, because you’re working off real data — not static snapshots.
- Integrated planning and analysis in one solution, no need to bounce between apps.
- Collaboration at scale, across finance, sales, HR, and supply chain.
- Agility: Create, adjust, and deliver plans quickly as the market changes.
Final Thoughts
SAP Analytics Cloud turns planning from a difficult yearly exercise into a real-time, business-critical process. You get pre-built financial planning content ready from day one — cost centers, profit centers, allocations, and more — plus dashboards and reports to monitor what’s actually happening, not just what you hoped for. It’s one system for building plans, simulating scenarios, adjusting forecasts, and tracking KPIs as the numbers roll in. Everything runs in a loop: plan, check, adapt, repeat. No silos, no guesswork. Just connected, collaborative, data-driven planning that moves as fast as your business does.
Frequently Asked Questions
1. Is SAC planning only for finance teams?
Not at all. Finance is just one of the points. SAP Analytics Cloud supports planning across sales, HR, supply chain, and capital planning too. In fact, the Rapid Planning Suite includes four sets of ready-to-use content: Finance, Sales, Workforce, and Capital. These can be used as-is or adapted to your process. And if your company runs a planning process that doesn’t fit into any of those categories, SAC gives you the flexibility to build custom models specifically for your case.
2. Can I try out changes without breaking the plan everyone else sees?
Yes, that’s the whole point of private versions. You can run what-ifs, change drivers, and simulate different outcomes — without anyone else seeing it or worrying about you breaking the shared data.
3. What if we already have Excel models we like?
That happens a lot. The good news is SAC doesn’t force you to give them up overnight. You can upload Excel files, use them alongside SAC models, and gradually shift over when you’re ready.
4. Is there a way to track tasks and deadlines in the planning process?
Yes. SAC includes a calendar and task management features. You can assign tasks, set due dates, and monitor progress right inside the system.
5. What about security?
SAC has role-based access control. That means users only see the parts of the plan they’re supposed to. Finance gets the full picture; department heads see just their area. It’s flexible and easy to adjust.


