

Denis Katkovskiy, SAP Basis Consultant at ACBaltica
The SAP EarlyWatch Alert (EWA) report is a proactive tool that is essential for maintaining optimal system performance and security. It provides detailed insights into system activities, hardware capabilities, and user interactions, helping administrators identify and address potential issues before they become critical. In this article, we'll cover the structure of the EWA report and explain how to use the information from every report section.
The SAP EarlyWatch Alert (EWA) is a monitoring and analysis service that proactively checks the health of your SAP systems. It identifies potential issues, system bottlenecks, and performance problems before they become critical. This handy tool not only helps you ensure optimal system performance and minimize downtime but also plays a crucial role in maintaining efficient operations. The report collects and analyzes data about system performance and detects issues. But the most valuable feature of the report is that it also suggests options on how to address detected issues and prevent the new ones. The benefits of the regular EWA service include improved system reliability, enhanced performance, and the ability to address issues proactively, ultimately leading to cost savings and better resource management. In other words, the EWA report is your one-stop solution to ensure your SAP system’s health and maximum performance.
There are two options to generate an EWA report: through SolMan 7.2 and using SAP Backbone:
-
To generate an EWA report through SolMan, follow SAP note 2729186. This report collects data from all types of systems (ABAP, Java, HANA).
-
To generate an EWA report through the Portal (SAP Backbone), follow the notes 2520319 and 207223. Unlike the previous option, this report collects data only from ABAP systems.
Whichever implementation method you choose, the report structure will be the same.
Structure of an EWA report
The EWA report is a PDF, DOC.doc, or HTML document either distributed by SolMan or available on SAP For Me (if you use SAP Backbone). You can receive the report via email or manually download it from SolMan.
Here is how you can access the report:

Report overview
The report is divided into thematic sections, the number and content of which will differ in different systems. This article reviews a real report created in SolMan 7.2 for an ABAP system. In our case, the structure of the report looks like this:
-
Service Summary
-
Landscape
-
Service Data Quality and Service Readiness
-
Software Configuration for <SID>(1)
-
Hardware Capacity
-
Workload of System <SID>(1)
-
Performance Overview <SID>(1)
-
RFC Load by Initiating Action
-
SAP Solution Manager General of <SID>(1)
-
SAP Solution Manager Usage of <SID>(1)
-
SAP System Operating <SID>(1)
-
Security
-
Software Change and Transport Management of <SID>(1)
-
Data Volume Management (DVM)
-
SAP HANA Database <SID>(2)
-
SAP HANA SQL Statements in <SID>(2)
-
SAP NetWeaver Gateway
-
UI Technologies Checks
-
Trend Analysis
The following sections are standard, and you can find them in any EWA report:
-
Service Summary
-
Landscape
-
Service Data Quality and Service Readiness
-
Software Configuration for <SID>
-
Security, Software Change, and Transport Management of <SID>.
Depending on the system used, the report may also include specific sections, such as Java System Data for <SID> (if the system uses Java), Problematic SQL Statements, etc.
Service summary
The 'Service Summary' section of the EWA report is not just a list of detected issues; it also includes recommendations for their resolution. For user convenience, the analysis results are marked with icons: green—everything is fine, yellow—attention needed, and red—urgent intervention required. This section describes the overall status of the system, including all indicators from the subsequent thematic sections. This approach is very convenient: you can immediately understand which sections require urgent attention.
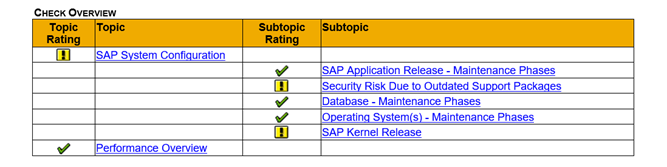
As you can see from the screenshot below, no issues with SAP System Operating were detected in our case.
As we already mentioned, the EWA report not only analyzes data but also provides recommendations on how to address the detected issues. For example, if new versions of the system kernel have been released, an update will be recommended:
If the security issue is detected, the report will likely suggest limiting user permissions.
Overall, these recommendations will be sufficient to resolve the identified issues. For example, in the screenshot below, there is a recommendation to reorganize the row storage with a reference to the relevant note (1813245).

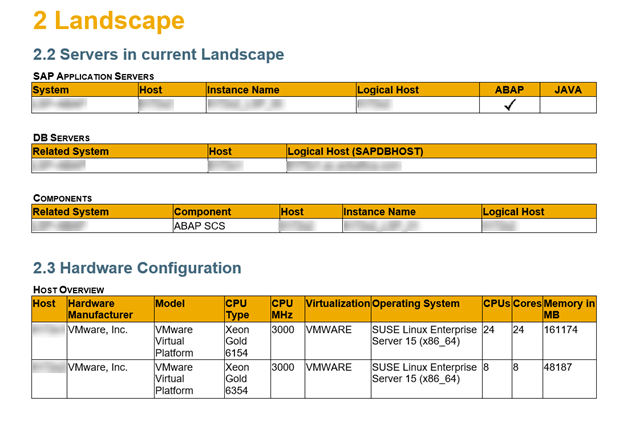
Landscape
This section of the report describes the SAP products and components involved in the system, the servers where they are hosted, and the hardware configuration. The data in this section helps assess whether the resources allocated for the SAP system are sufficient. You can also find the hosts, which you may need to reconfigure.
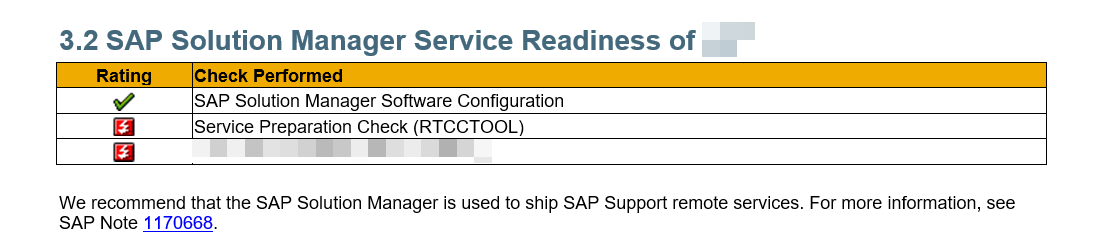
Service Data Quality and Service Readiness
This section of the EWA report displays the EWA settings and readiness on the analyzed system. If something is not configured or missing on the analyzed system, you will find recommendations for addressing that.
In our example, we got the recommendation to use SolMan for shipping SAP Support remote services:
In our case, the analyzed system has unmet options: the required level of ST-PI for the data collectors to explore the SAP HANA database needs to be included. It is also recommended that the ST-A/PI and ST-PI packages be updated.

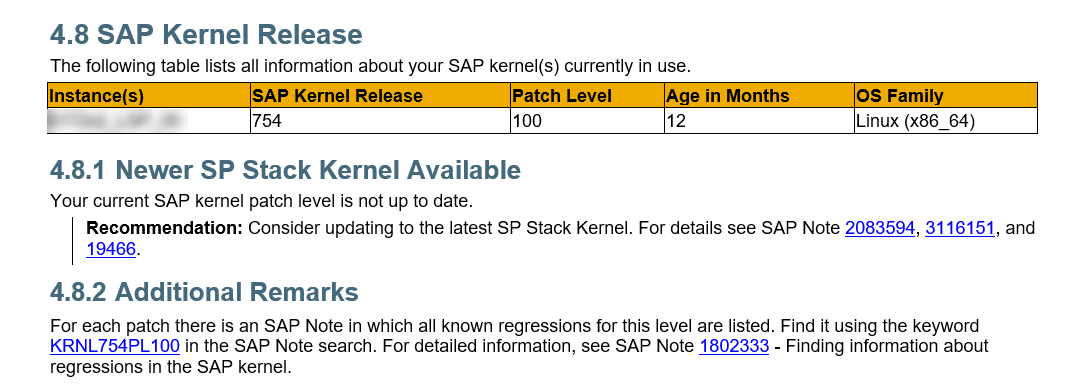
Software Configuration for <SID>(1)
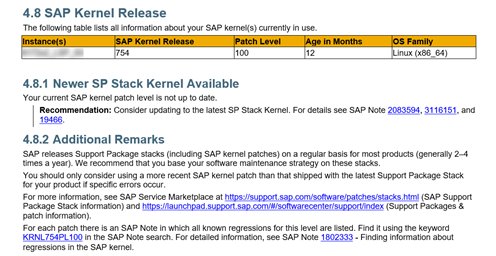
This report section describes the SAP system software configuration, including the applications server, database, OS, SP version, SAP kernel, and more.
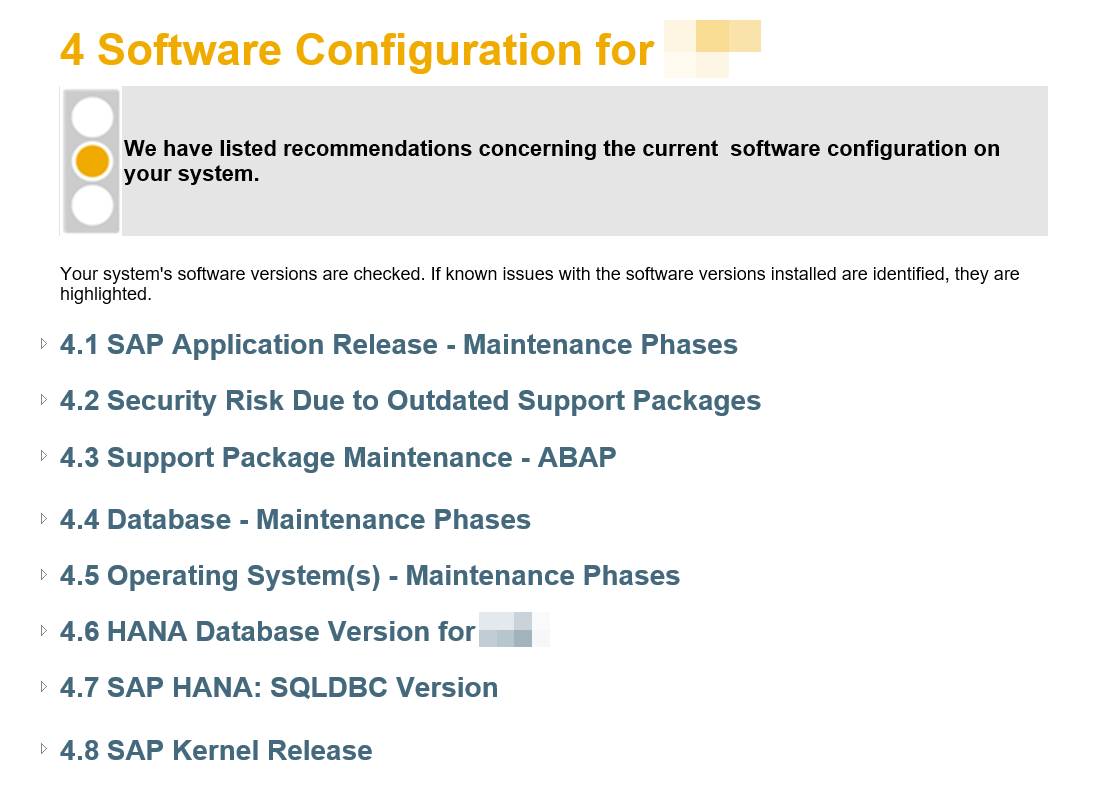
Here, you can also find a recommendation to update the SP version:
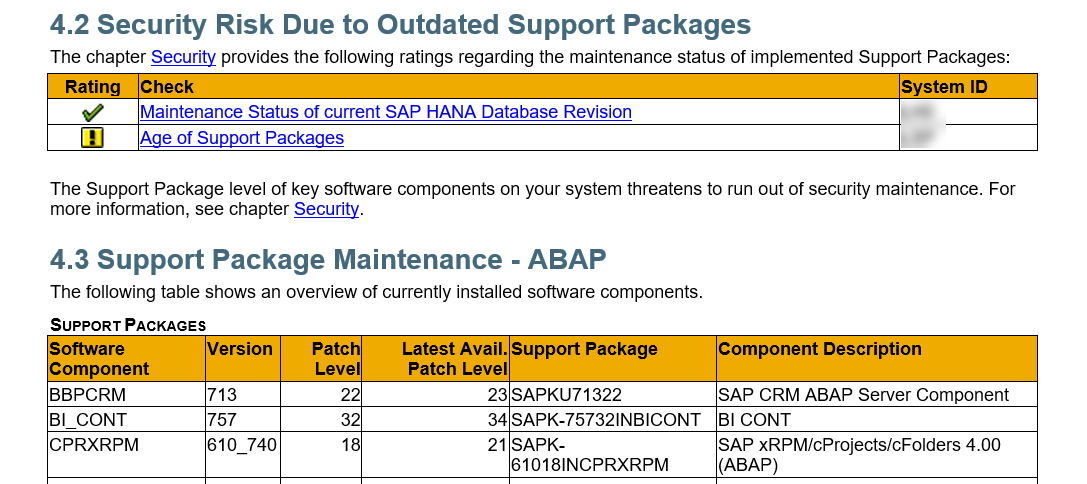
Also, in our case, the report recommends updating the system kernel, along with some additional comments:
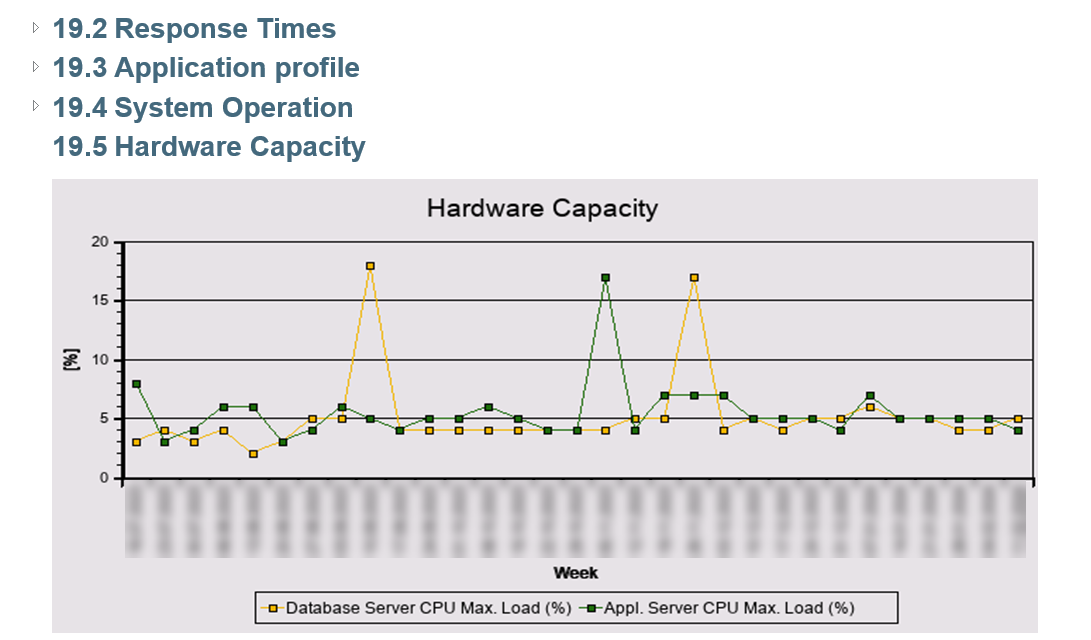
Hardware Capacity
This section allows you to identify hardware resource shortages over a weekly period of system activity. It specifies the CPU load during this period and the adequacy of memory. For example, it shows if there was a resource shortage over the past seven days that led to reduced service response times or system hang-ups. If this section indicates resource shortages, consider adding the necessary resources (also based on the data from the Landscape section) or taking other measures to optimize the system.
In our analyzed system, you can see there are no issues with resource shortages.

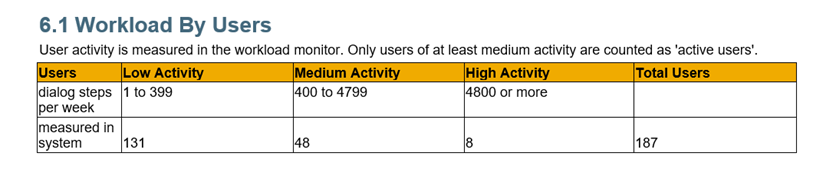
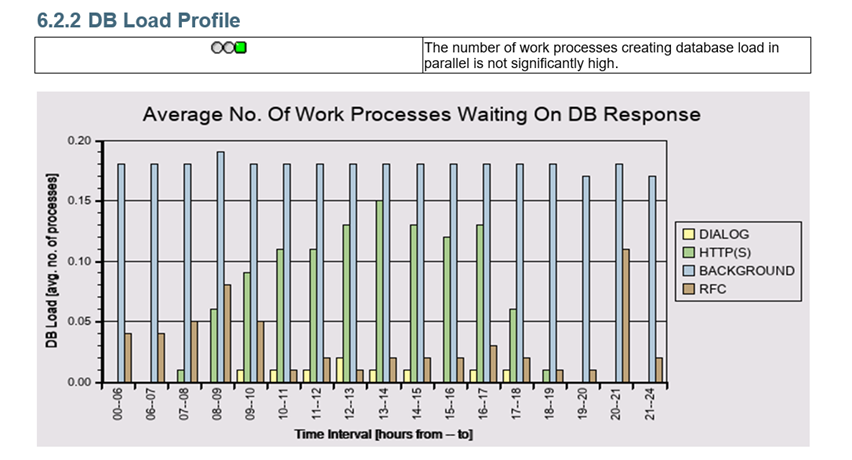
Workload of System <SID>(1)
This section describes the SAP system's workload over the working week, including which tasks are used more frequently.
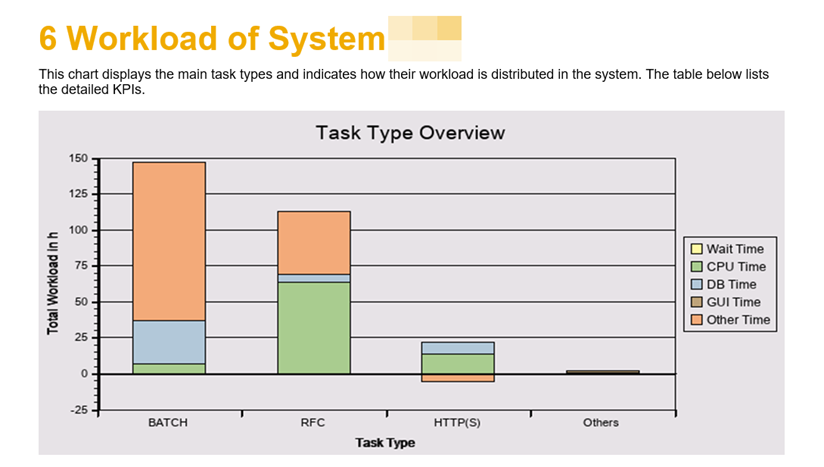
The user-generated workload in the system:
You can get an overview of the volume of these task types. The diagram below shows the weekly volume of work processes.
Performance Overview <SID>(1)
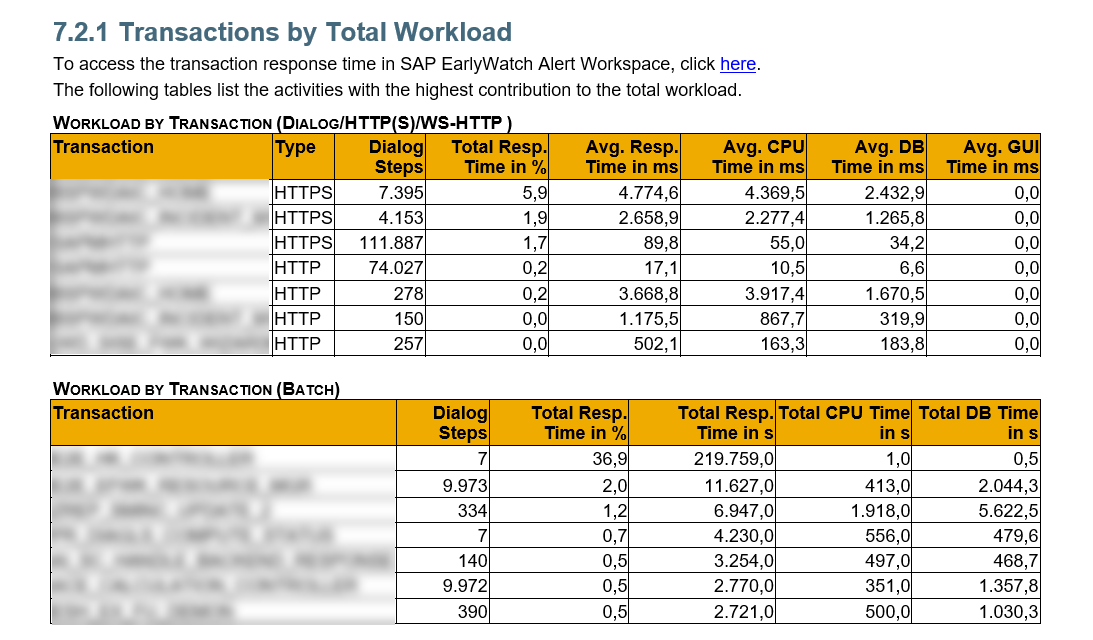
This section analyzes the performance of some system elements, focusing on response times for specific tasks and the load during particular transactions.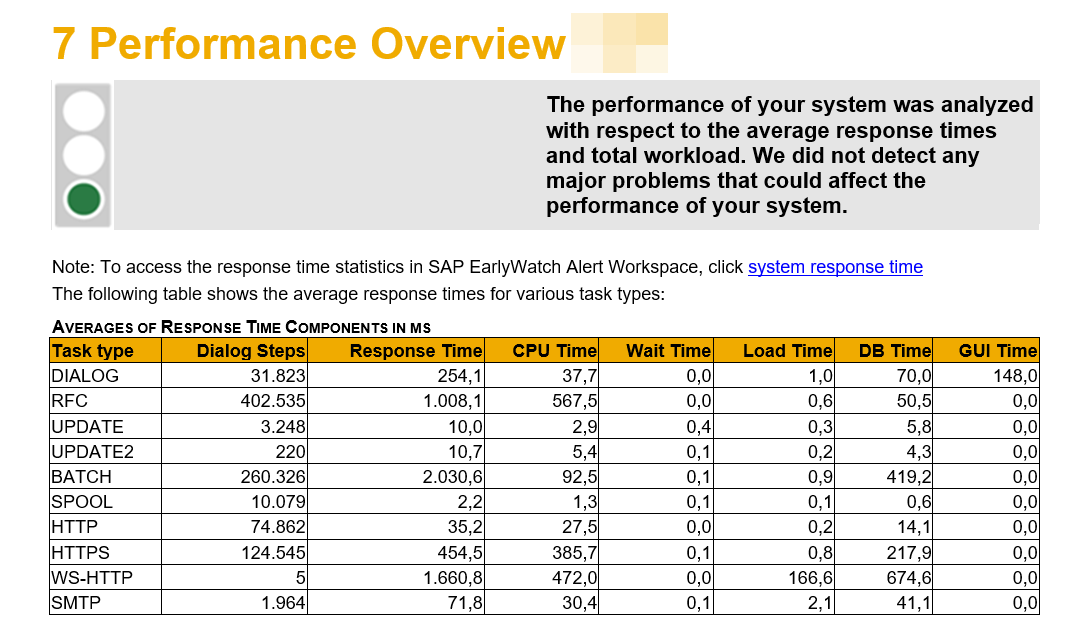
In the tables below, you can see the workload generated by specific transactions compared to the total workload:
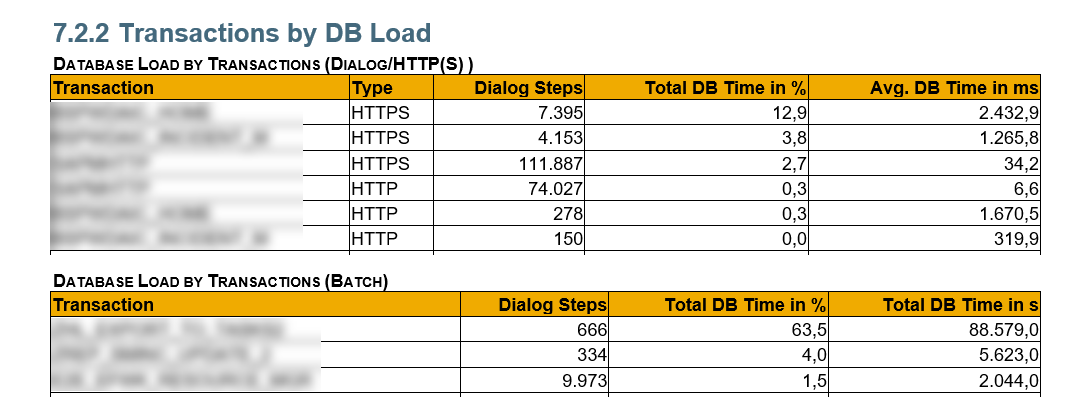
Transactions load in the database:
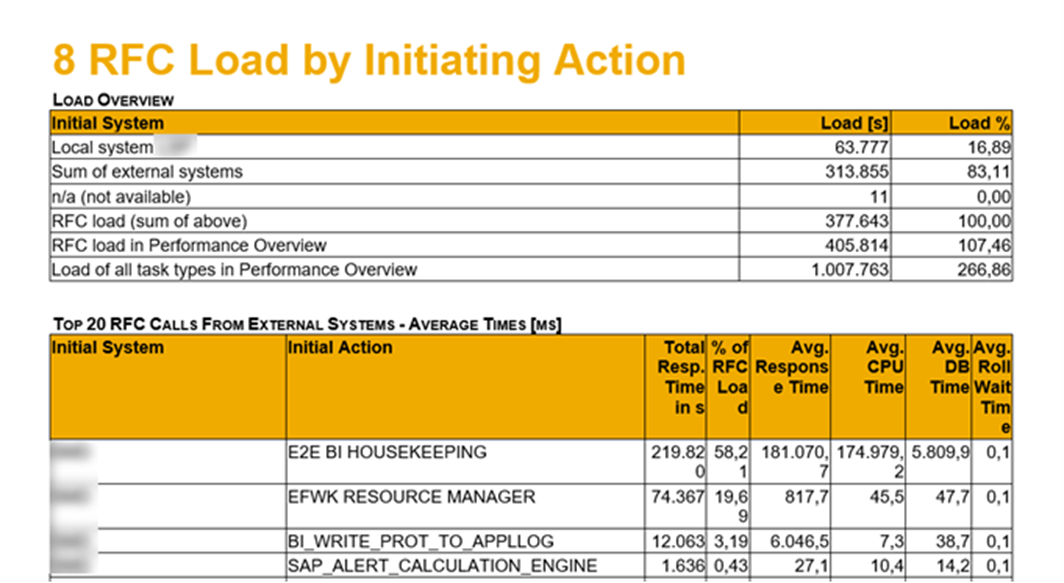
RFC Load by Initiating Action
This section displays the load on RFCs. The analysis includes the response time for RFC calls and lists external systems' most frequently used RFC calls.
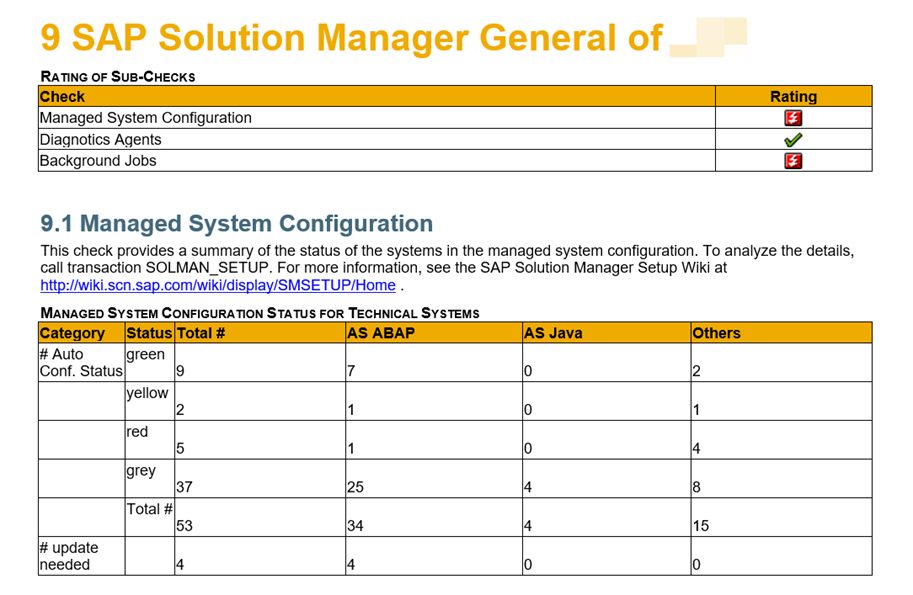
SAP Solution Manager General of <SID>(1)
If the SAP system has a specific specialization, the EWA report will include sections related to this functionality. In these sections, you will find statistics on managed systems, the overall status of these systems, the status of diagnostic agents, and the scheduled background jobs for SolMan.
SAP Solution Manager Usage of <SID>(1)
This section provides a more detailed description of the managed systems, their quantity, available EWA sessions, and more.
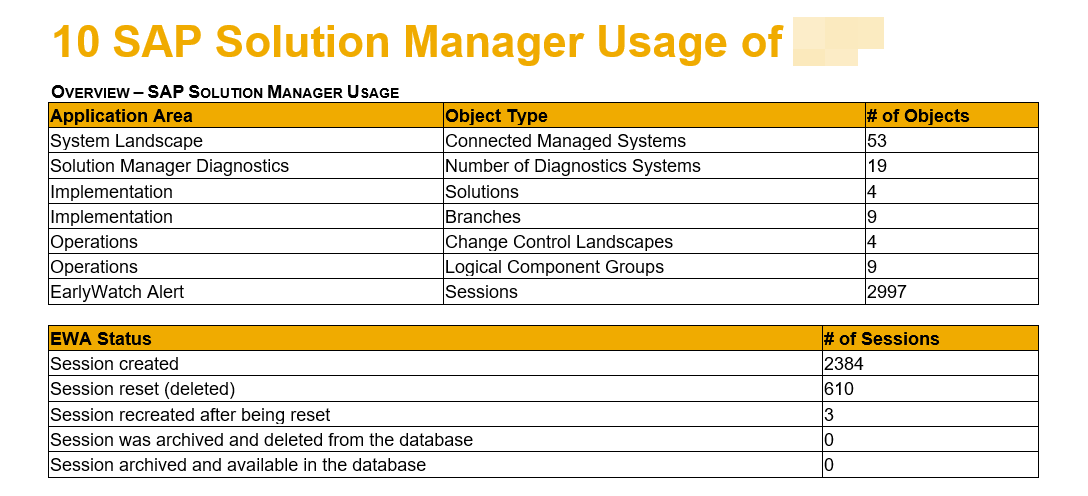
Also, here you can find a more detailed description of SolMan usage, implemented solutions, and more.
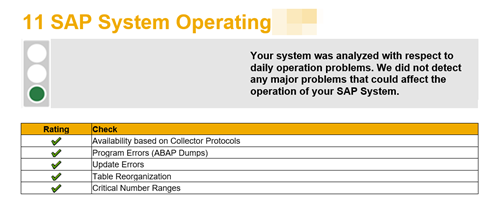
SAP System Operating <SID>(1)
This section shows how the SAP system operates, describes availability based on Collector Protocols, lists update errors, database table reorganizations, software errors, and more. For example, the following table allows you to assess errors that occurred during the last seven days.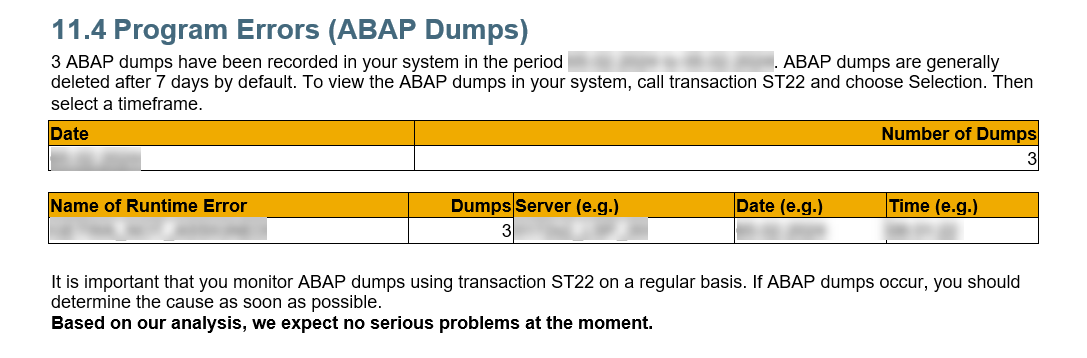
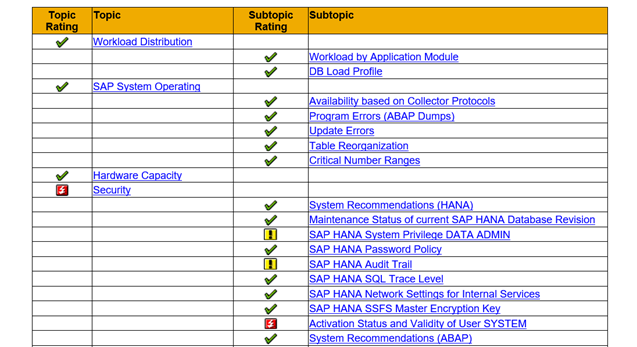
Safety
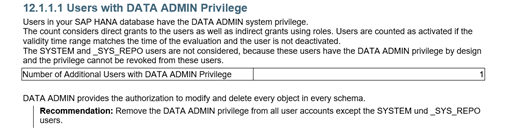
System security analysis is an integral part of the EWA report. The table below shows which issues need to be addressed first (red alert)—we strongly recommend not ignoring these warnings.
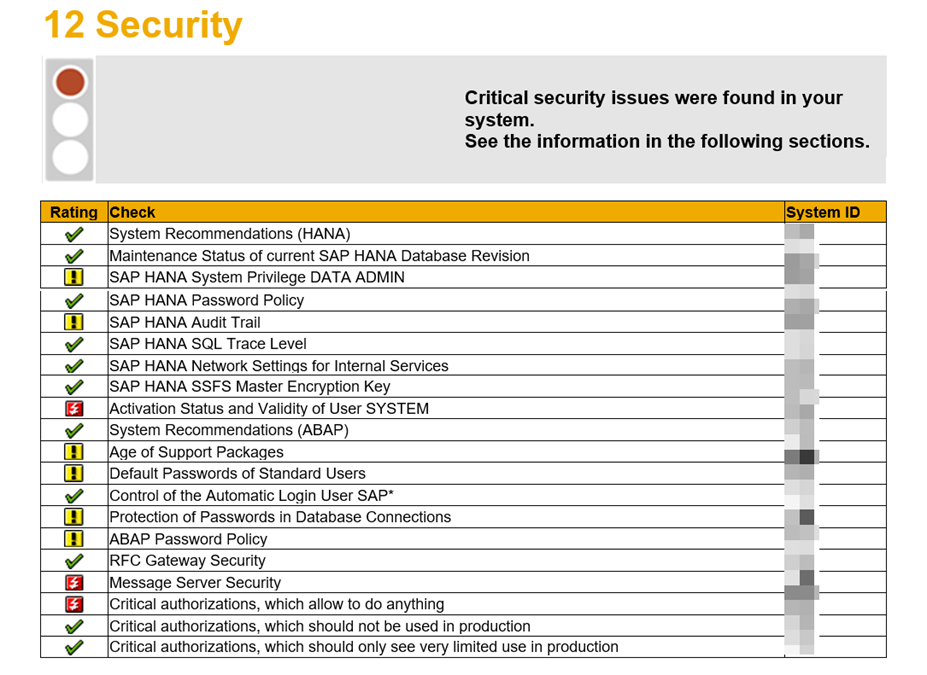
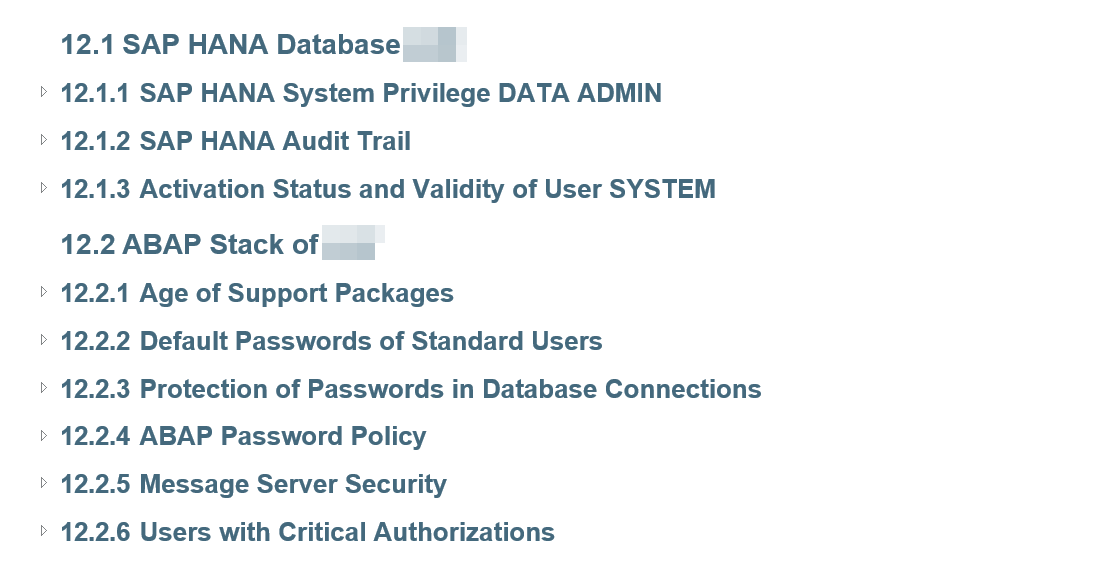
The subsections of the report examine vulnerabilities of SAP HANA and ABAP/Java in more detail.
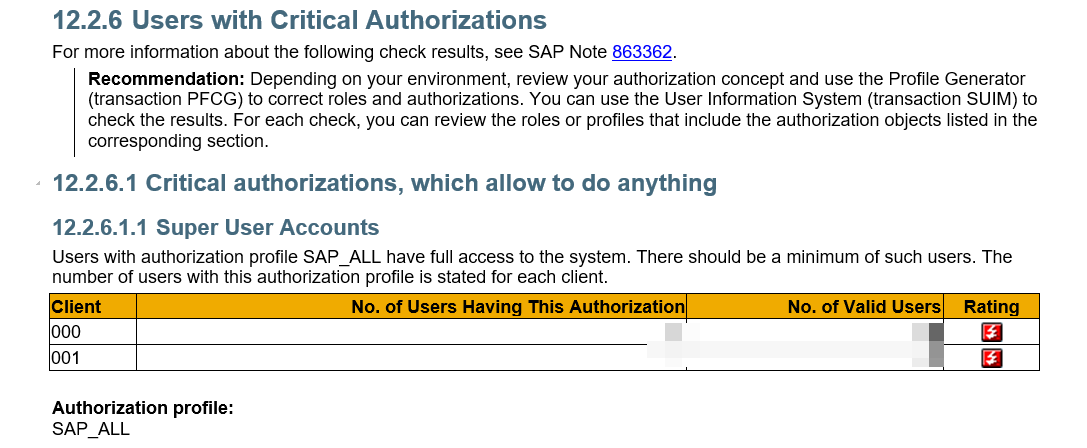
For example, this subsection allows you to quickly determine which users (and how many of them) have the highest SAP_ALL level credentials.
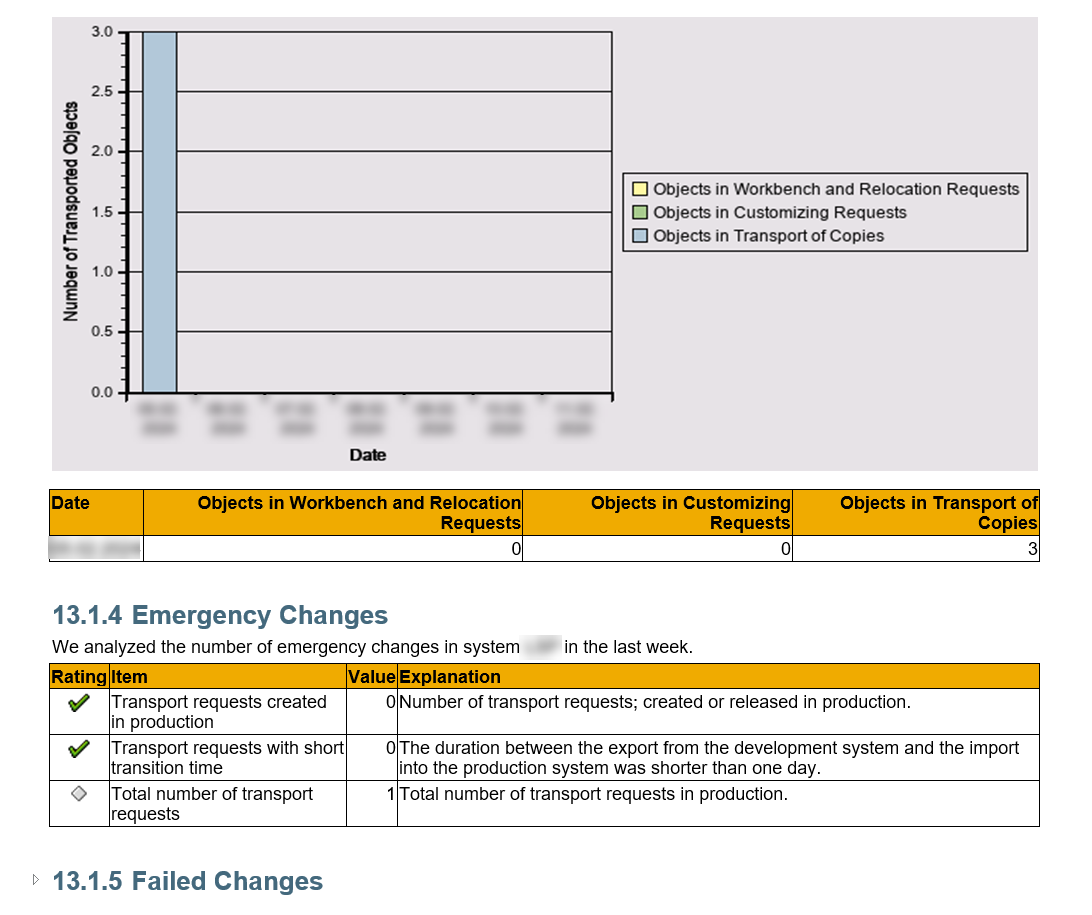
Software Change and Transport Management of <SID>(1)
This section describes changes in the SAP system, transport requests, and failed changes.
Data Volume Management (DVM)
This section assesses the volume of data in the system and how it has grown over a year.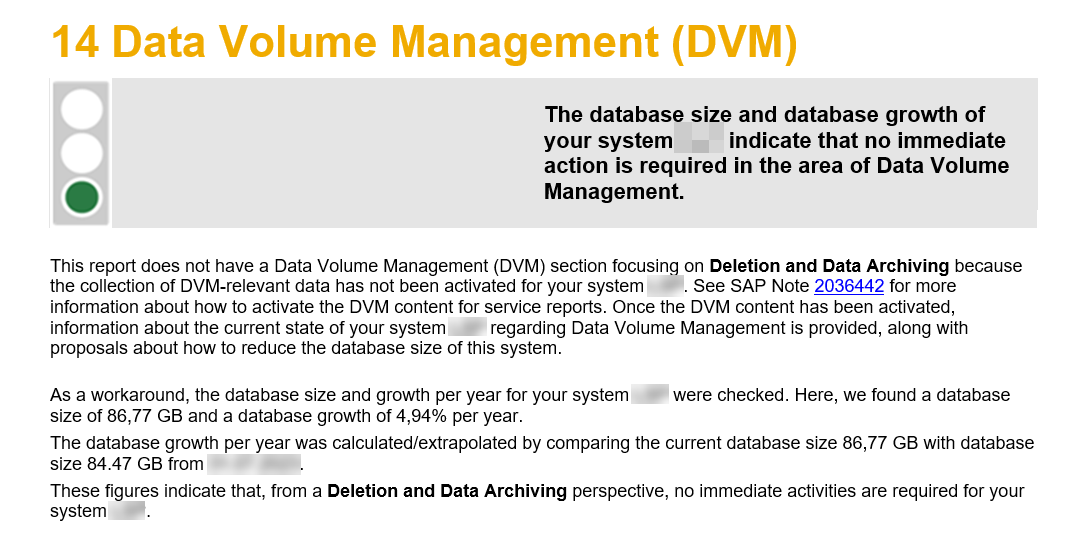
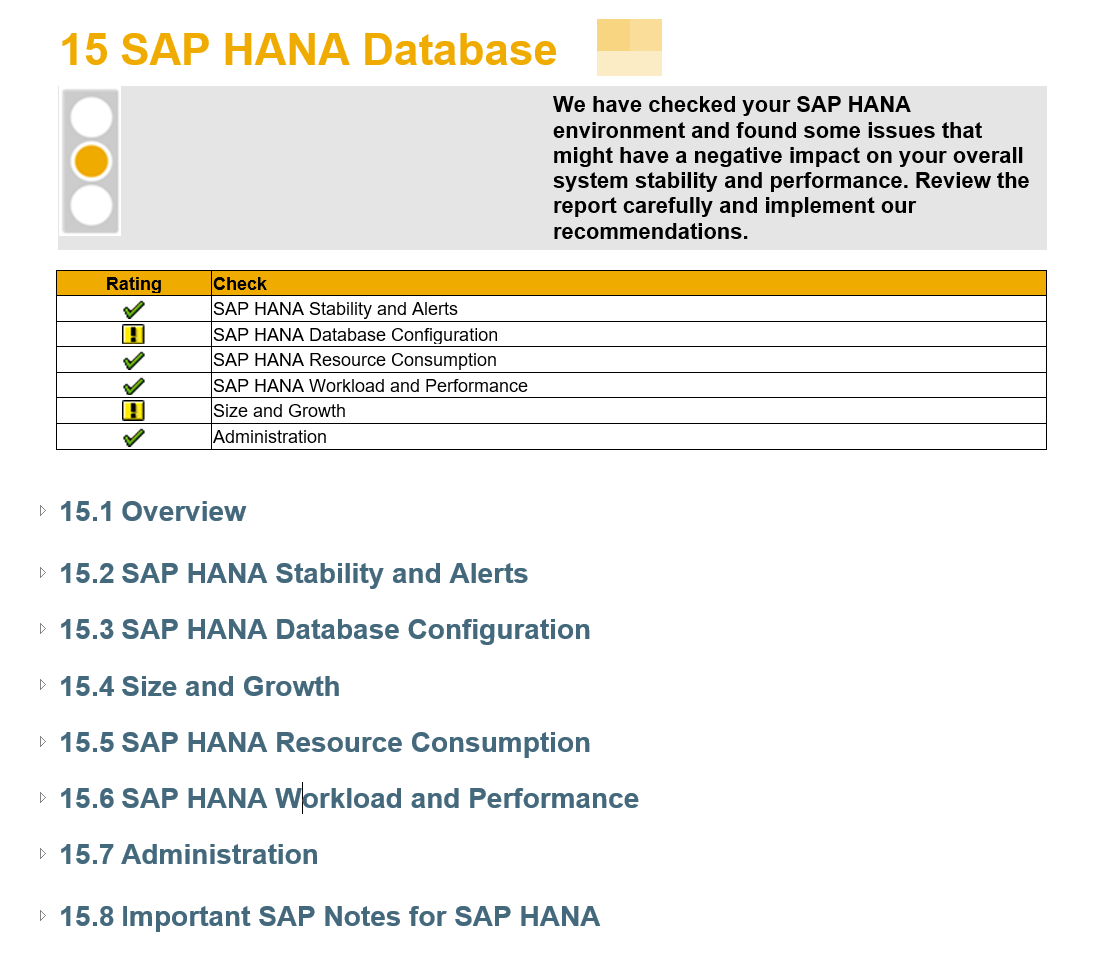
SAP HANA Database <SID>(2)
In this article, we use an ABAP application server and SAP HANA database as an example. Accordingly, the SAP HANA Database section covers the stability of its operation, warnings occurring in SAP HANA, database size, size of the tables in the schema, resource consumption by the database, load and performance, database administration, and recommendations (relevant SAP notes applicable to this database).
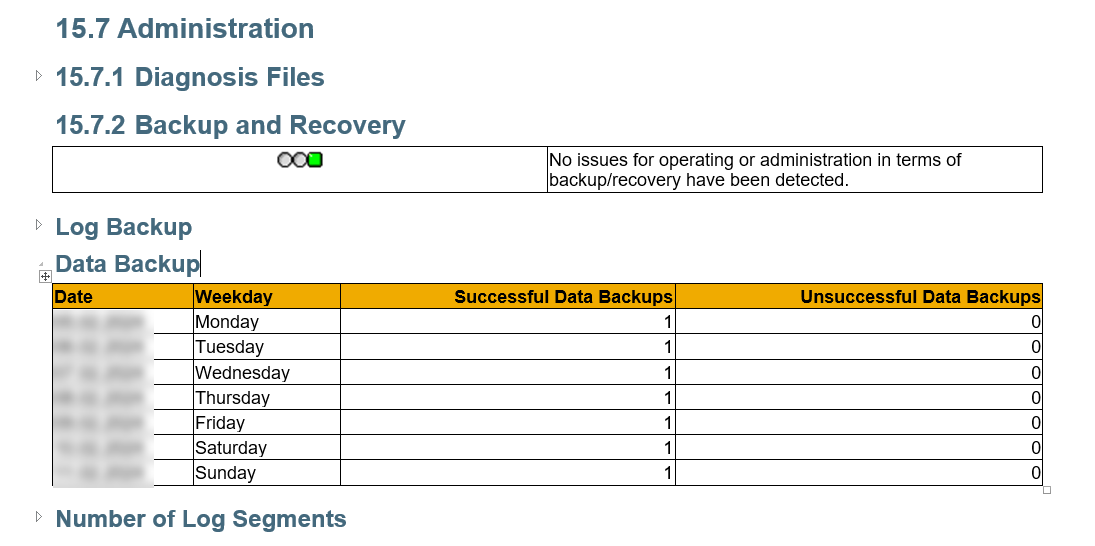
In the Administration section, you can evaluate backups and logs:
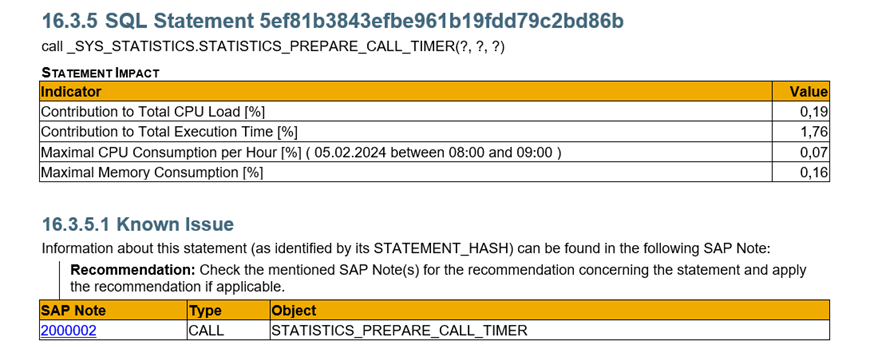
SAP HANA SQL Statements in <SID>(2)
This section provides detailed information on SQL instructions.
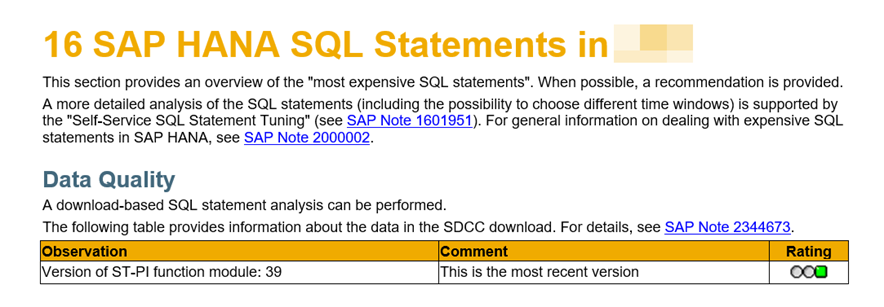
It covers key aspects of using SQL statements, including time consumption instructions, top scanned tables, memory and CPU consumption, and more.
Along with SQL instructions, you can find recommendations on possible improvements and adjustments.
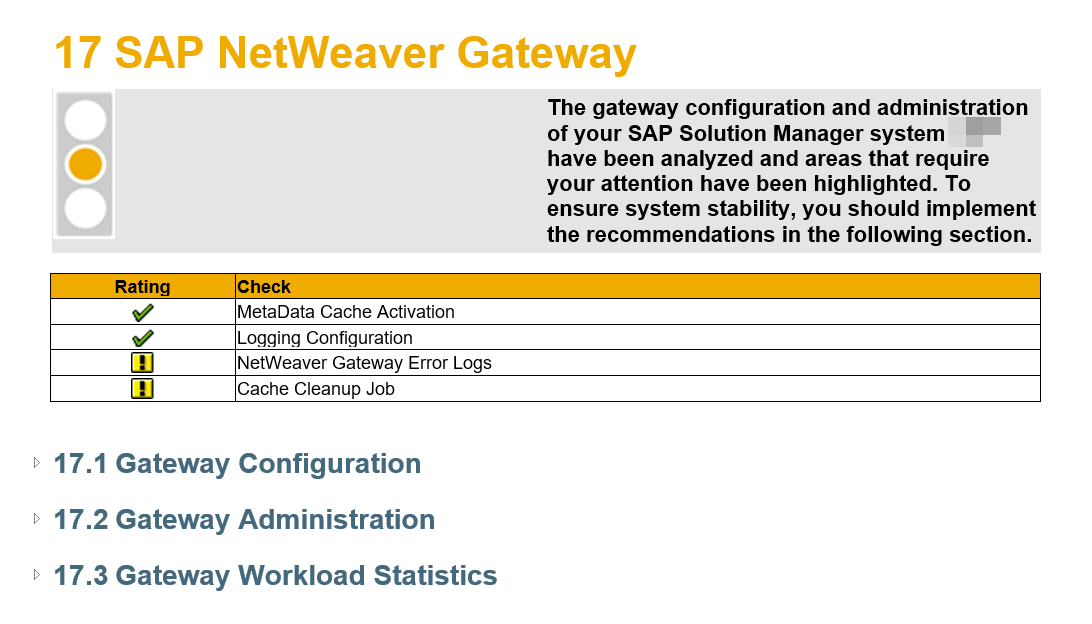
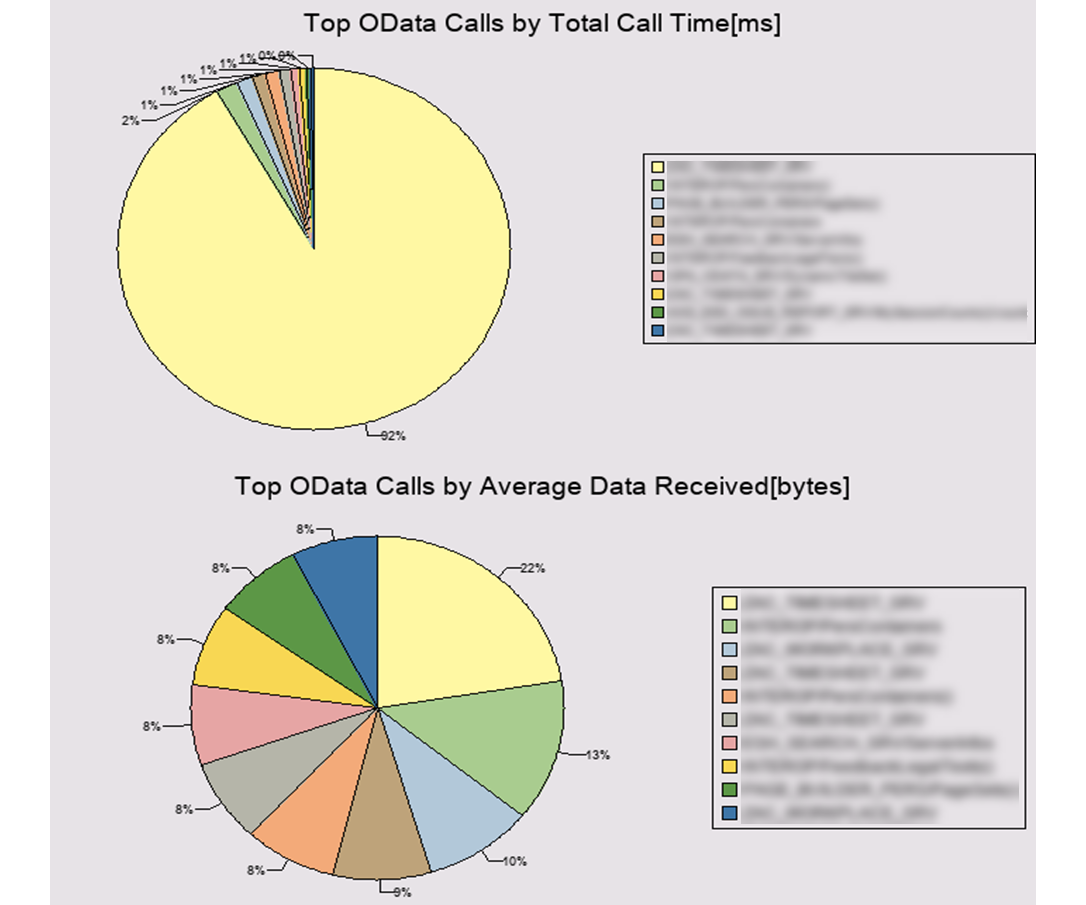
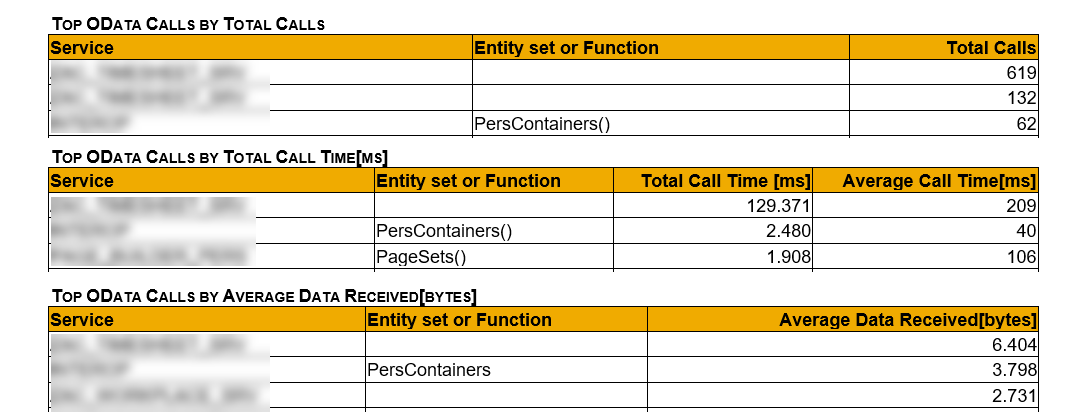
SAP NetWeaver Gateway
This section covers gateway configuration, administration, and statistics.
The OData usage statistics can be presented as a pie chart and a table, showing the total number of OData calls, total time spent on calls, and volume of data received per call.
UI Technologies Checks
This section describes the implementation of UI technologies in the SAP system. It checks whether the versions of UI technologies, such as SAP_UI and SAPUI5, are sufficient. It also checks the status of HTTP/2 and verifies if the necessary notes for SAP Fiori have been implemented and if the ICF services in UI5 applications have been activated.

In our case, the report includes a warning that HTTP/2 is not activated on the analyzed system and a recommendation on how to fix this issue (see below).

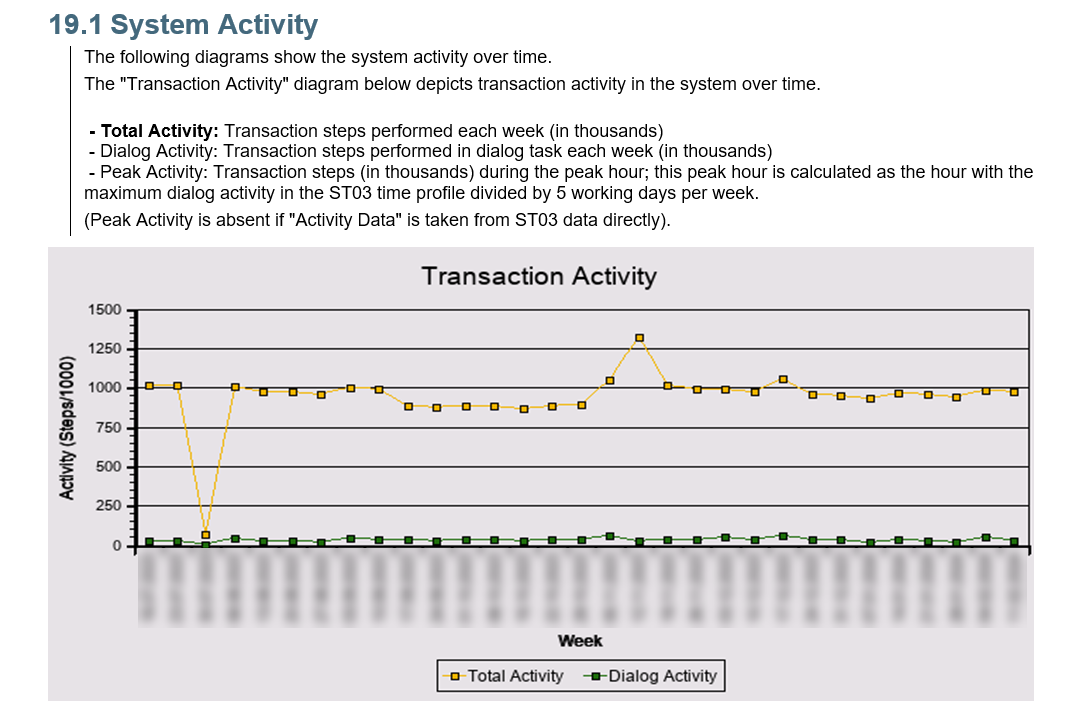
Trend Analysis
In this section, you will find an analysis of trends for key performance indicators (KPIs). The metrics are presented as charts – like, in our case, an overall transactional activity in the system over time (see below):
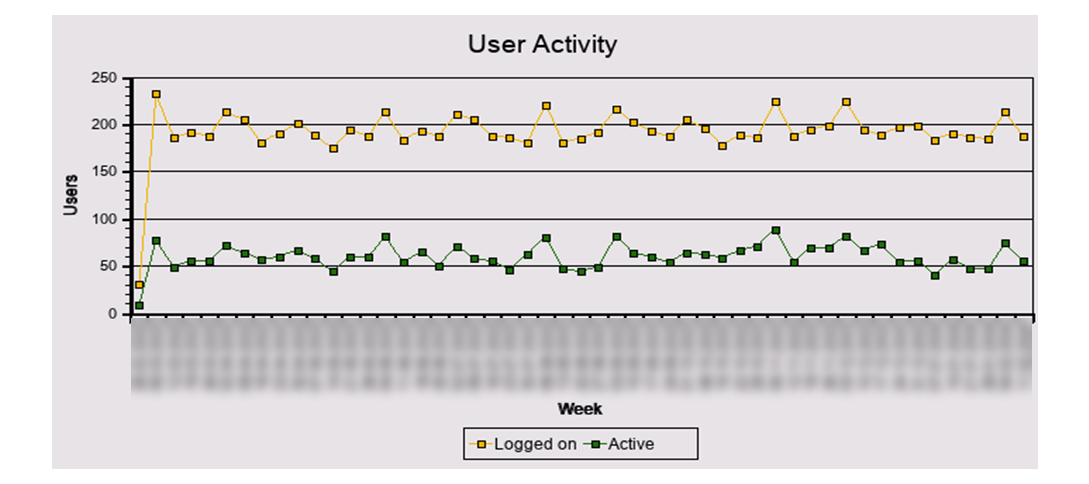
Here is how user activity is described:
Along with some other indicators (response time, system performance, hardware capabilities):
If you need more details on how to configure the EWA report and make the most of it, contact us to book a consultation. We’ll be happy to assist you!
Subscribe